Define Only Higher or Lower Bound of ggplot2 Axis Limit in R (Example Code)
In this article, I’ll explain how to define only the lower or upper bound of a ggplot2 axis limit in the R programming language.
Preparing the Example
data(iris) # Load & inspect data head(iris) # Sepal.Length Sepal.Width Petal.Length Petal.Width Species # 1 5.1 3.5 1.4 0.2 setosa # 2 4.9 3.0 1.4 0.2 setosa # 3 4.7 3.2 1.3 0.2 setosa # 4 4.6 3.1 1.5 0.2 setosa # 5 5.0 3.6 1.4 0.2 setosa # 6 5.4 3.9 1.7 0.4 setosa |
install.packages("ggplot2") # Install & load ggplot2 library("ggplot2") |
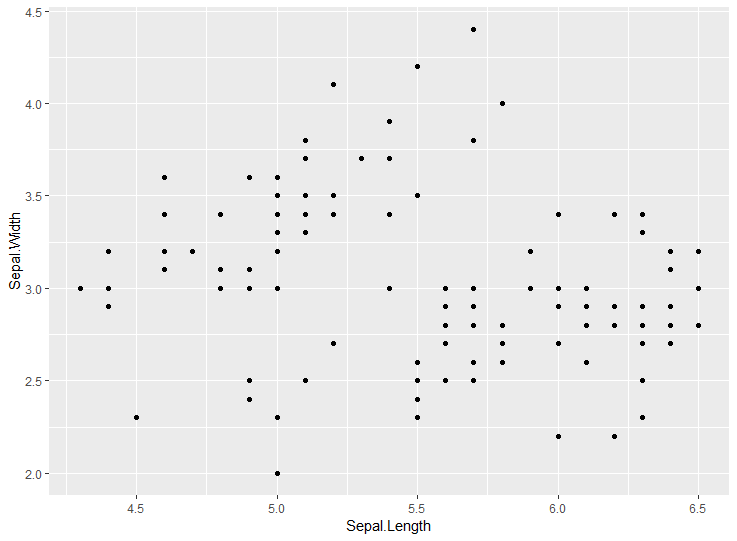
my_plot <- ggplot(iris, aes(Sepal.Length, Sepal.Width)) + # Basic ggplot2 of iris geom_point() my_plot # Draw plot |

Example: Modifying Only Upper X-Axis Limit
my_plot + # Change x-axis limits manually scale_x_continuous(limits = c(NA, 6.5)) |