How to Create Only One ggplot2 Legend in R (Example Code)
In this tutorial you’ll learn how to create only a single ggplot2 legend in the R programming language.
Setting up the Example
set.seed(876435) # Creating random data my_df <- data.frame(x1 = rnorm(100), x2 = rnorm(100), my_shapes = letters[1:4], my_colors = letters[1:4]) head(my_df) # Head of data # x1 x2 my_shapes my_colors # 1 2.60613589 0.2015005 a a # 2 0.04928746 0.4702312 b b # 3 0.83441786 0.5546141 c c # 4 -0.06498267 1.2490154 d d # 5 1.75731612 -1.4194633 a a # 6 0.06409565 1.2595519 b b |
set.seed(876435) # Creating random data my_df <- data.frame(x1 = rnorm(100), x2 = rnorm(100), my_shapes = letters[1:4], my_colors = letters[1:4]) head(my_df) # Head of data # x1 x2 my_shapes my_colors # 1 2.60613589 0.2015005 a a # 2 0.04928746 0.4702312 b b # 3 0.83441786 0.5546141 c c # 4 -0.06498267 1.2490154 d d # 5 1.75731612 -1.4194633 a a # 6 0.06409565 1.2595519 b b
install.packages("ggplot2") # Install ggplot2 package library("ggplot2") # Load ggplot2 |
install.packages("ggplot2") # Install ggplot2 package library("ggplot2") # Load ggplot2
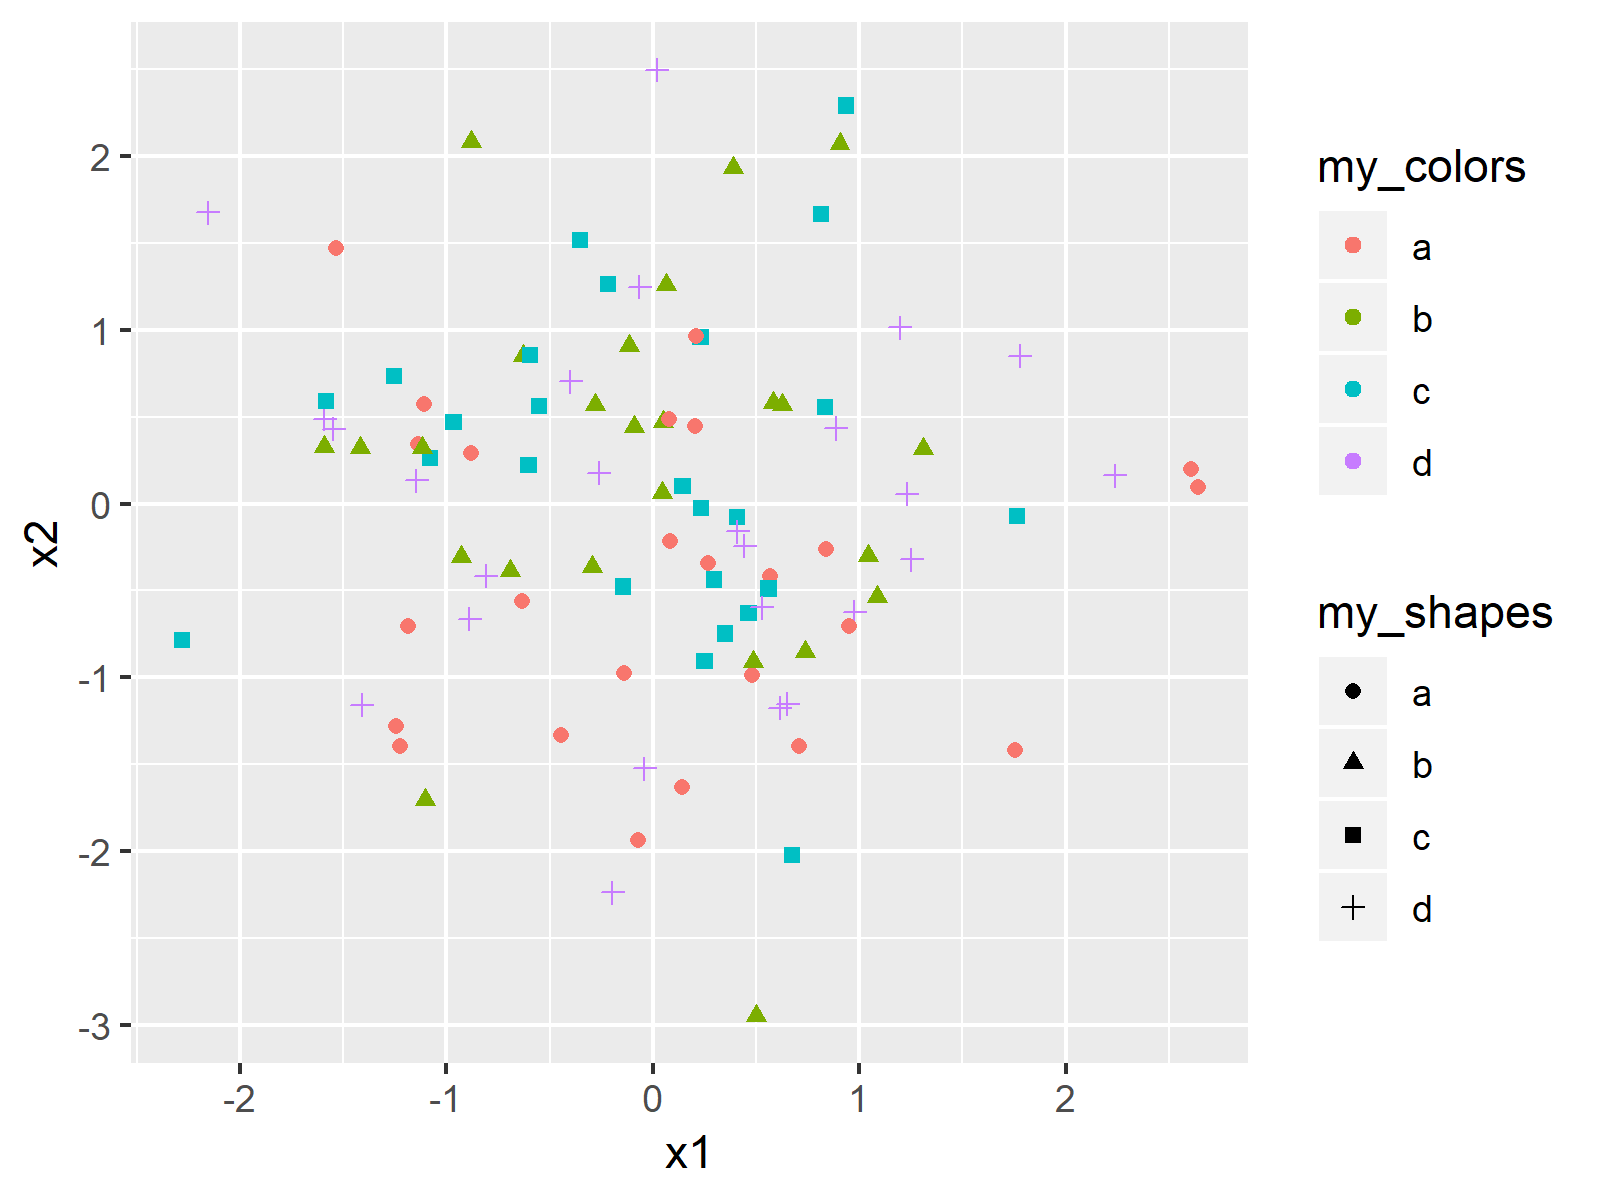
ggplot(my_df, aes(x = x1, y = x2, # Creating ggplot2 graph shape = my_shapes, color = my_colors)) + geom_point() |
ggplot(my_df, aes(x = x1, y = x2, # Creating ggplot2 graph shape = my_shapes, color = my_colors)) + geom_point()

Example: Create Shared Legend Using Same Input for shape & color Arguments
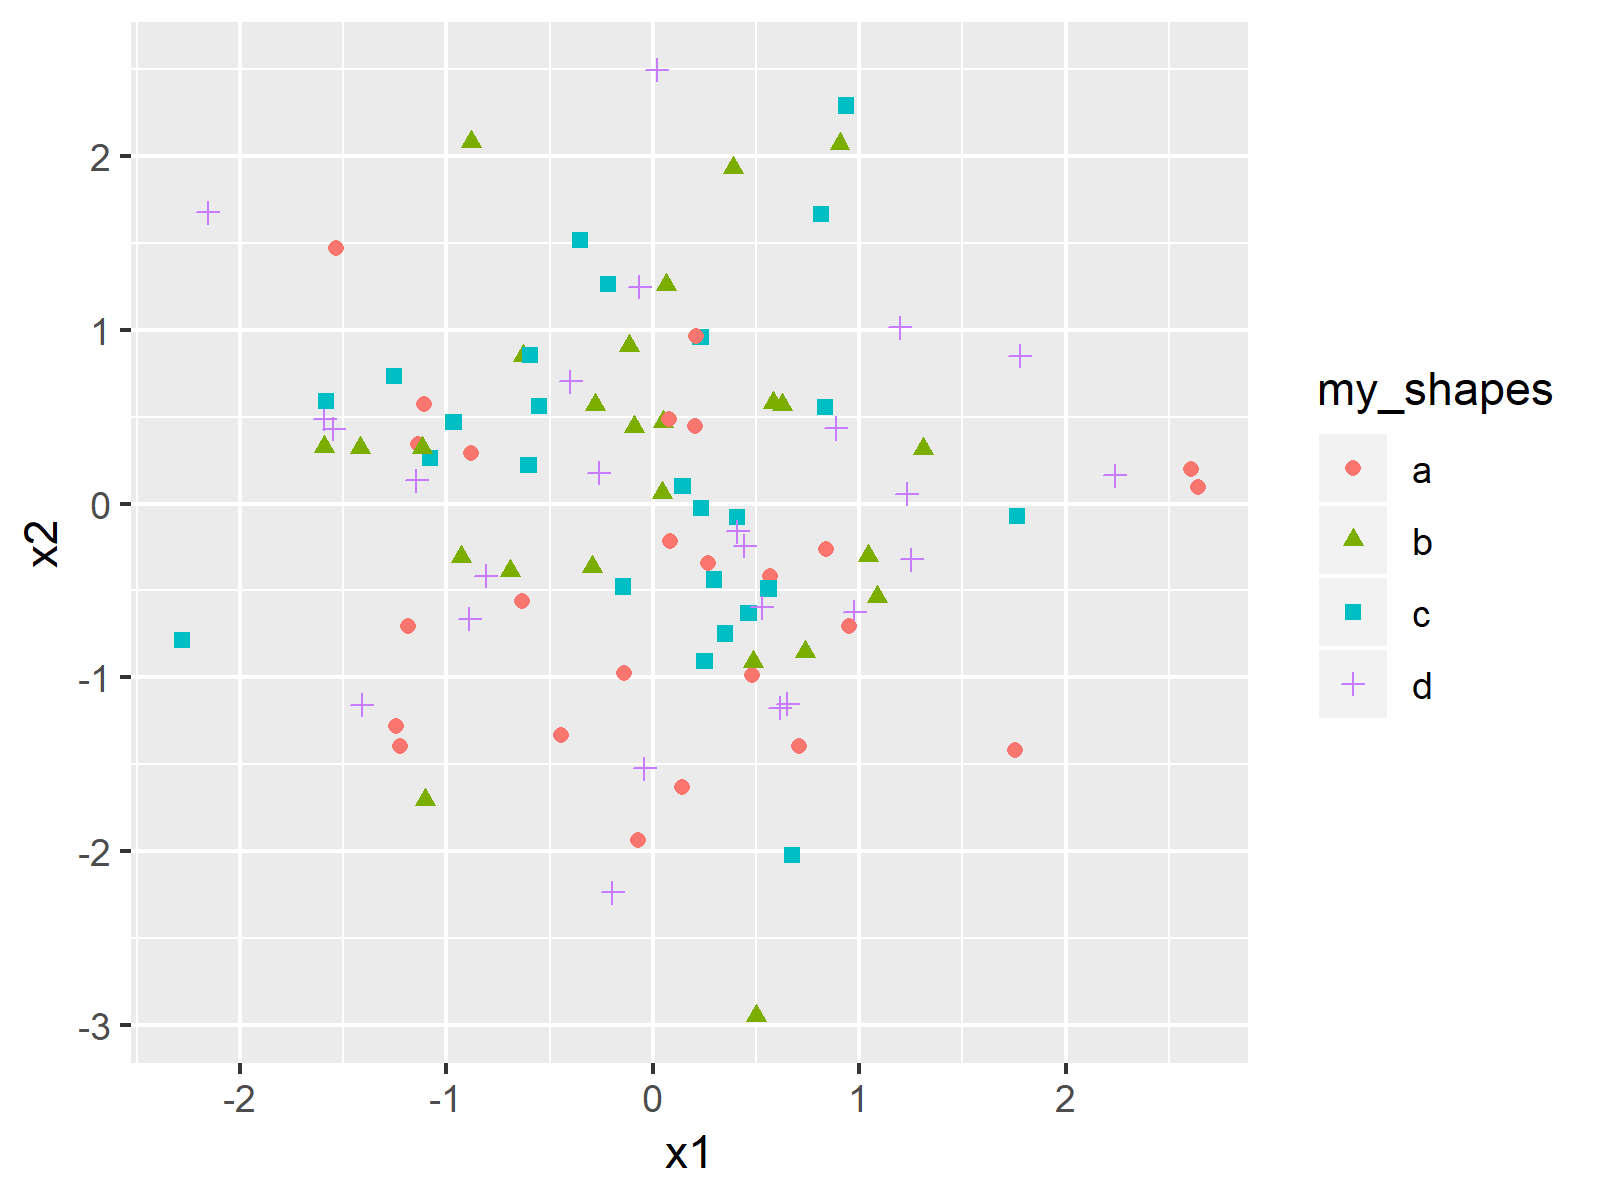
ggplot(my_df, aes(x = x1, y = x2, # Creating ggplot2 graph again shape = my_shapes, color = my_shapes)) + # Redefine color geom_point() |
ggplot(my_df, aes(x = x1, y = x2, # Creating ggplot2 graph again shape = my_shapes, color = my_shapes)) + # Redefine color geom_point()

