R How to Control Legend Item Ordering of ggplot2 Plot (Example Code)
In this article you’ll learn how to sort the legend items of a ggplot2 plot manually in R programming.
Setting up the Example
data(iris) # Iris data head(iris) # Sepal.Length Sepal.Width Petal.Length Petal.Width Species # 1 5.1 3.5 1.4 0.2 setosa # 2 4.9 3.0 1.4 0.2 setosa # 3 4.7 3.2 1.3 0.2 setosa # 4 4.6 3.1 1.5 0.2 setosa # 5 5.0 3.6 1.4 0.2 setosa # 6 5.4 3.9 1.7 0.4 setosa |
data(iris) # Iris data head(iris) # Sepal.Length Sepal.Width Petal.Length Petal.Width Species # 1 5.1 3.5 1.4 0.2 setosa # 2 4.9 3.0 1.4 0.2 setosa # 3 4.7 3.2 1.3 0.2 setosa # 4 4.6 3.1 1.5 0.2 setosa # 5 5.0 3.6 1.4 0.2 setosa # 6 5.4 3.9 1.7 0.4 setosa
install.packages("ggplot2") # Install ggplot2 package library("ggplot2") # Load ggplot2 package |
install.packages("ggplot2") # Install ggplot2 package library("ggplot2") # Load ggplot2 package
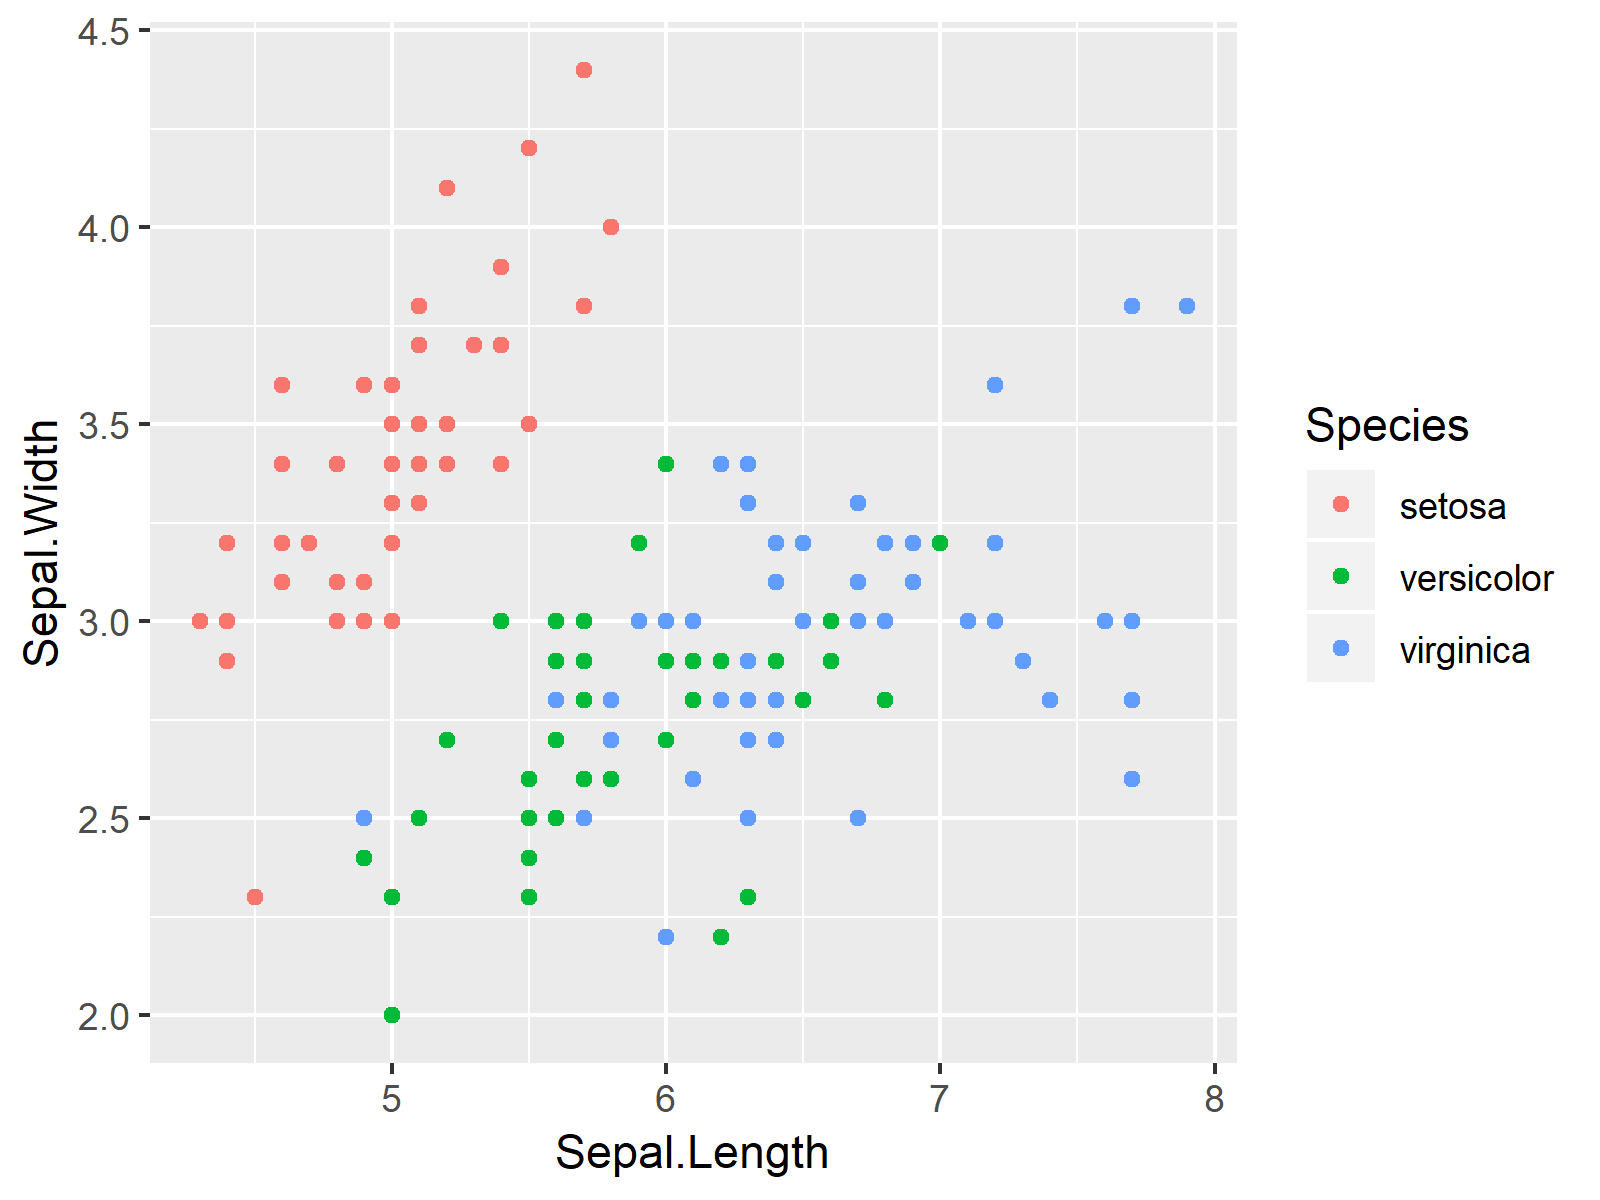
ggplot(iris, # Default legend order of ggplot2 plot aes(x = Sepal.Length, y = Sepal.Width, color = Species)) + geom_point() |
ggplot(iris, # Default legend order of ggplot2 plot aes(x = Sepal.Length, y = Sepal.Width, color = Species)) + geom_point()

Example: Manually Specify Order of ggplot2 Legend Items
iris_new <- iris # Replicate iris |
iris_new <- iris # Replicate iris
iris_new$Species <- factor(iris_new$Species, # Relevel group factor levels = c("virginica", "setosa", "versicolor")) |
iris_new$Species <- factor(iris_new$Species, # Relevel group factor levels = c("virginica", "setosa", "versicolor"))
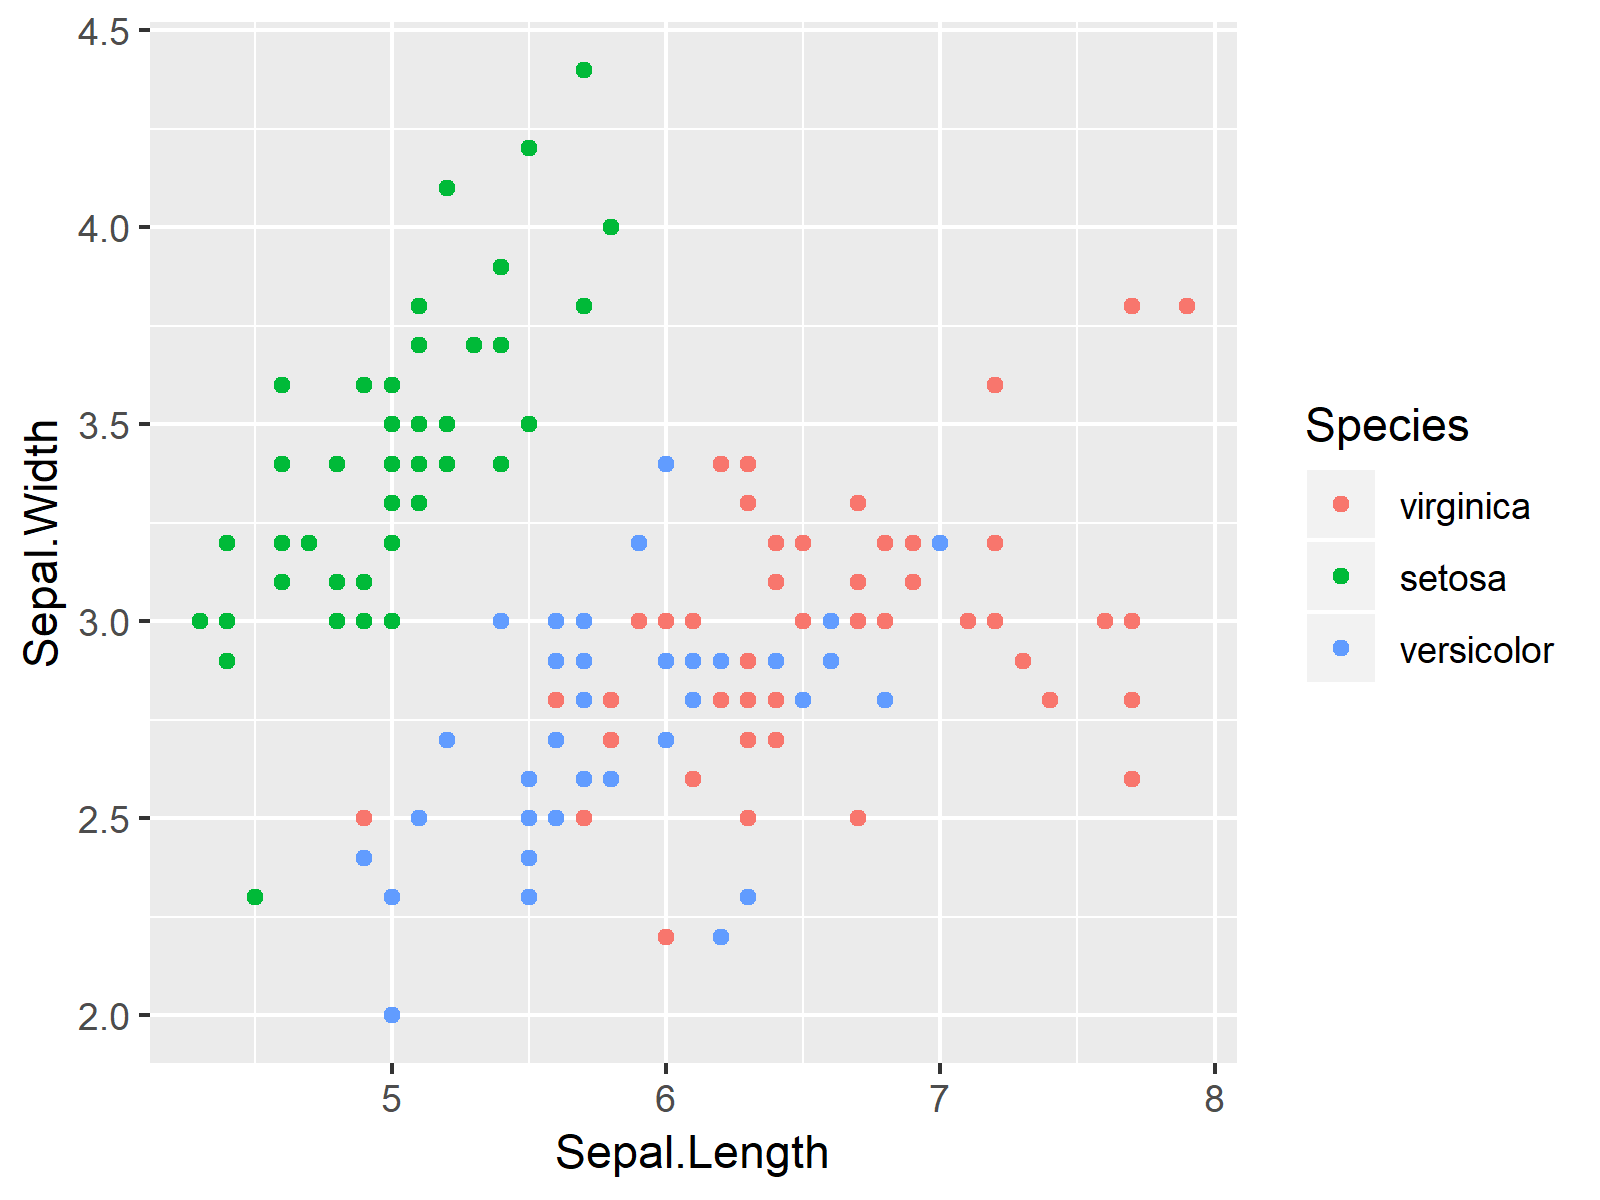
ggplot(iris_new, # ggplot2 plot with different legend order aes(x = Sepal.Length, y = Sepal.Width, color = Species)) + geom_point() |
ggplot(iris_new, # ggplot2 plot with different legend order aes(x = Sepal.Length, y = Sepal.Width, color = Species)) + geom_point()

