Creating Venn Diagram with Proportional Size in R (2 Examples)
In this article, I’ll illustrate how to create venn diagrams where the size of the circles is proportional in the R programming language.
Example 1: Using venneuler Package to Draw Venn Diagram with Proportional Size
install.packages("venneuler") # Install & load venneuler library("venneuler") |
install.packages("venneuler") # Install & load venneuler library("venneuler")
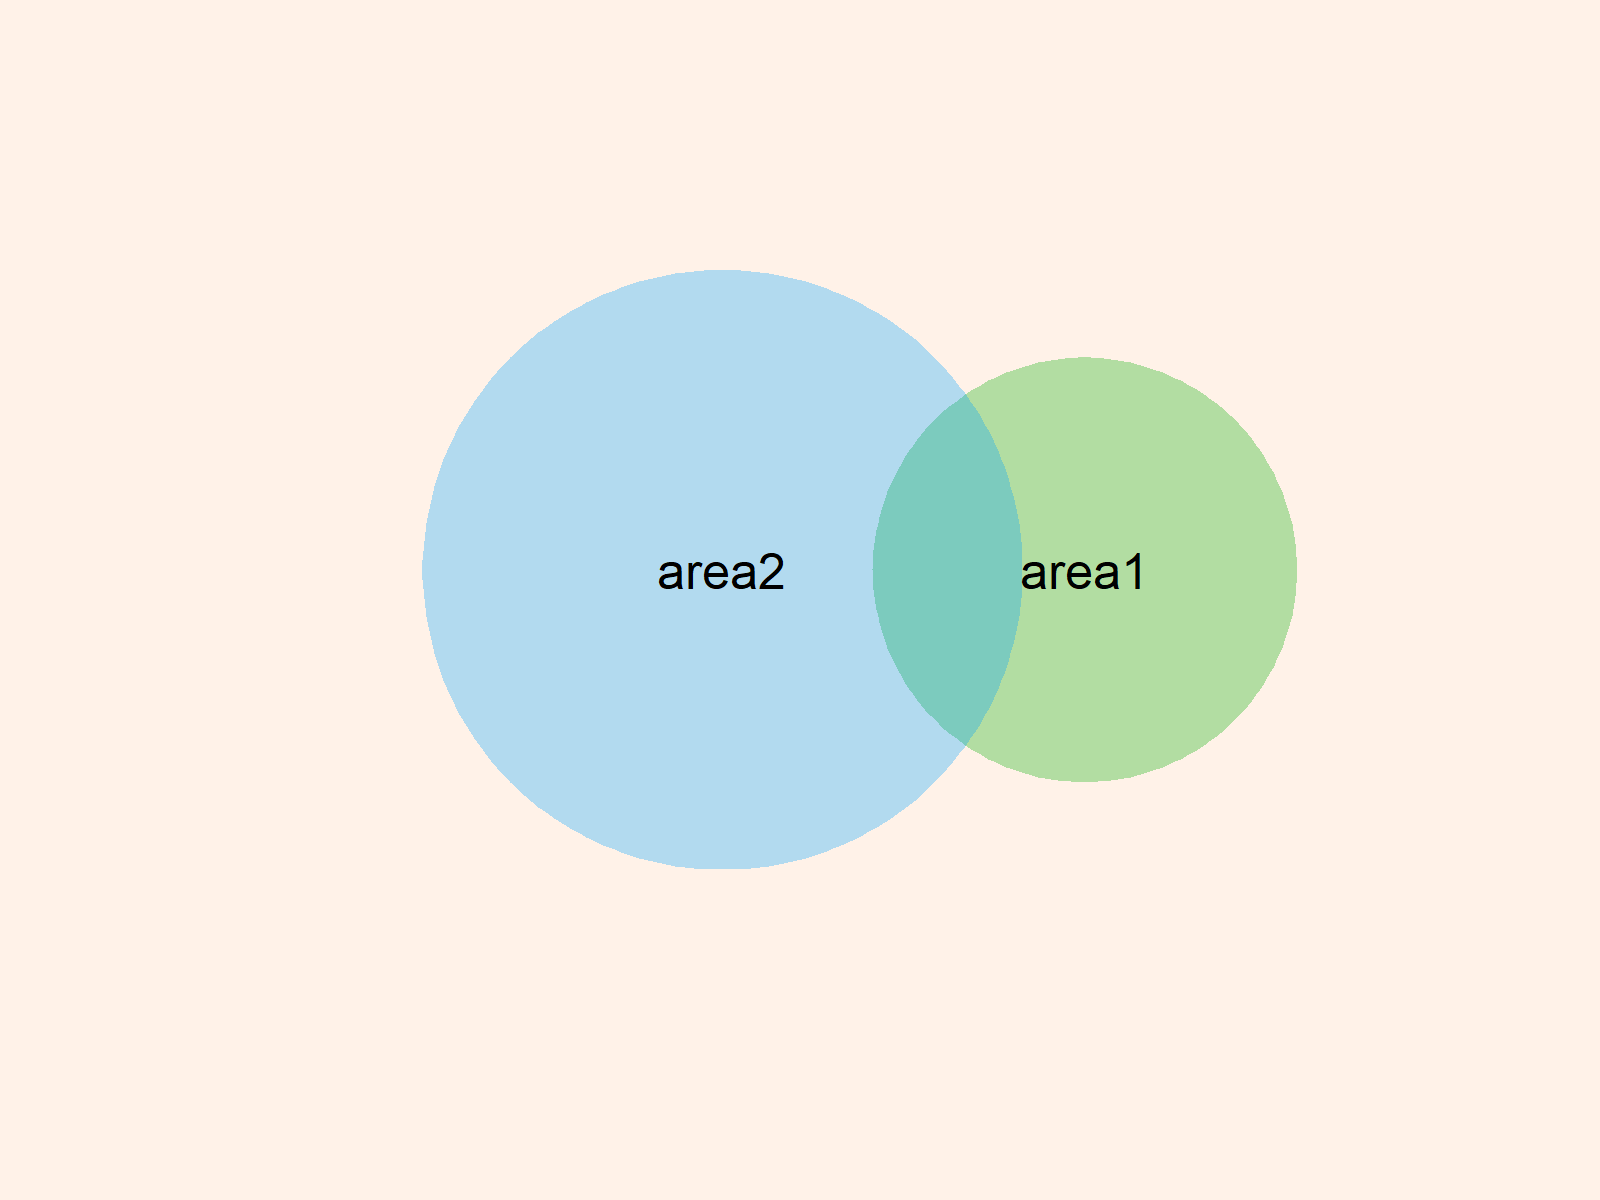
plot(venneuler(c(area1 = 30, # Creating venn diagram with venneuler area2 = 70, "area1&area2" = 10))) |
plot(venneuler(c(area1 = 30, # Creating venn diagram with venneuler area2 = 70, "area1&area2" = 10)))

Example 2: Using VennDiagram Package to Draw Venn Diagram with Proportional Size
install.packages("VennDiagram") # Install VennDiagram package library("VennDiagram") # Load VennDiagram package |
install.packages("VennDiagram") # Install VennDiagram package library("VennDiagram") # Load VennDiagram package
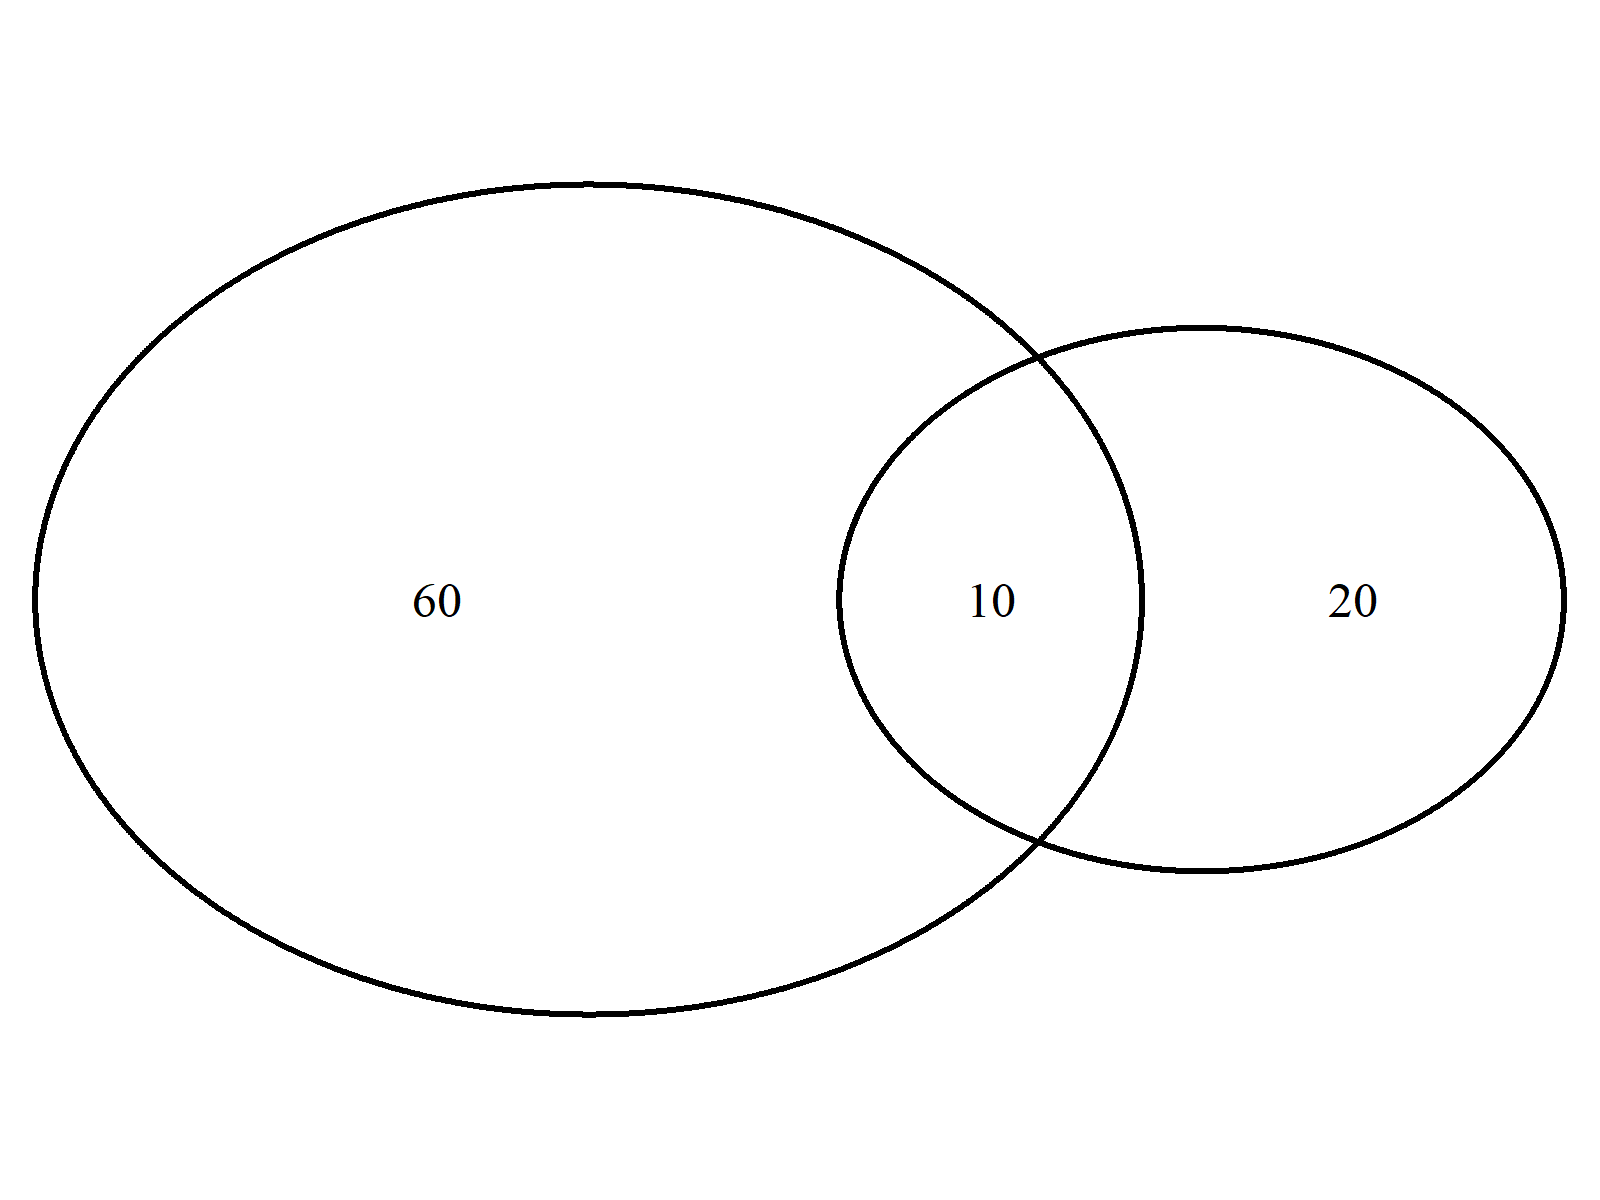
grid.newpage() # Creating venn diagram with VennDiagram draw.pairwise.venn(area1 = 30, area2 = 70, cross.area = 10) |
grid.newpage() # Creating venn diagram with VennDiagram draw.pairwise.venn(area1 = 30, area2 = 70, cross.area = 10)

