Avoid Gap in ggplot2 Line Plot with NA Values in R (Example Code)
This page illustrates how to connect the lines in a line plot with missing values in the R programming language.
Setting up the Example
data(iris) # Loading & preparing a data set iris_NA <- iris[ , c(1, 5)] iris_NA$Sepal.Length[c(1, 4, 5, 8:15, 50:55, 70:80, 120:140)] <- NA iris_NA$count <- 1:50 head(iris_NA) # Sepal.Length Species count # 1 NA setosa 1 # 2 4.9 setosa 2 # 3 4.7 setosa 3 # 4 NA setosa 4 # 5 NA setosa 5 # 6 5.4 setosa 6 |
data(iris) # Loading & preparing a data set iris_NA <- iris[ , c(1, 5)] iris_NA$Sepal.Length[c(1, 4, 5, 8:15, 50:55, 70:80, 120:140)] <- NA iris_NA$count <- 1:50 head(iris_NA) # Sepal.Length Species count # 1 NA setosa 1 # 2 4.9 setosa 2 # 3 4.7 setosa 3 # 4 NA setosa 4 # 5 NA setosa 5 # 6 5.4 setosa 6
install.packages("ggplot2") # Install ggplot2 package library("ggplot2") # Load ggplot2 |
install.packages("ggplot2") # Install ggplot2 package library("ggplot2") # Load ggplot2
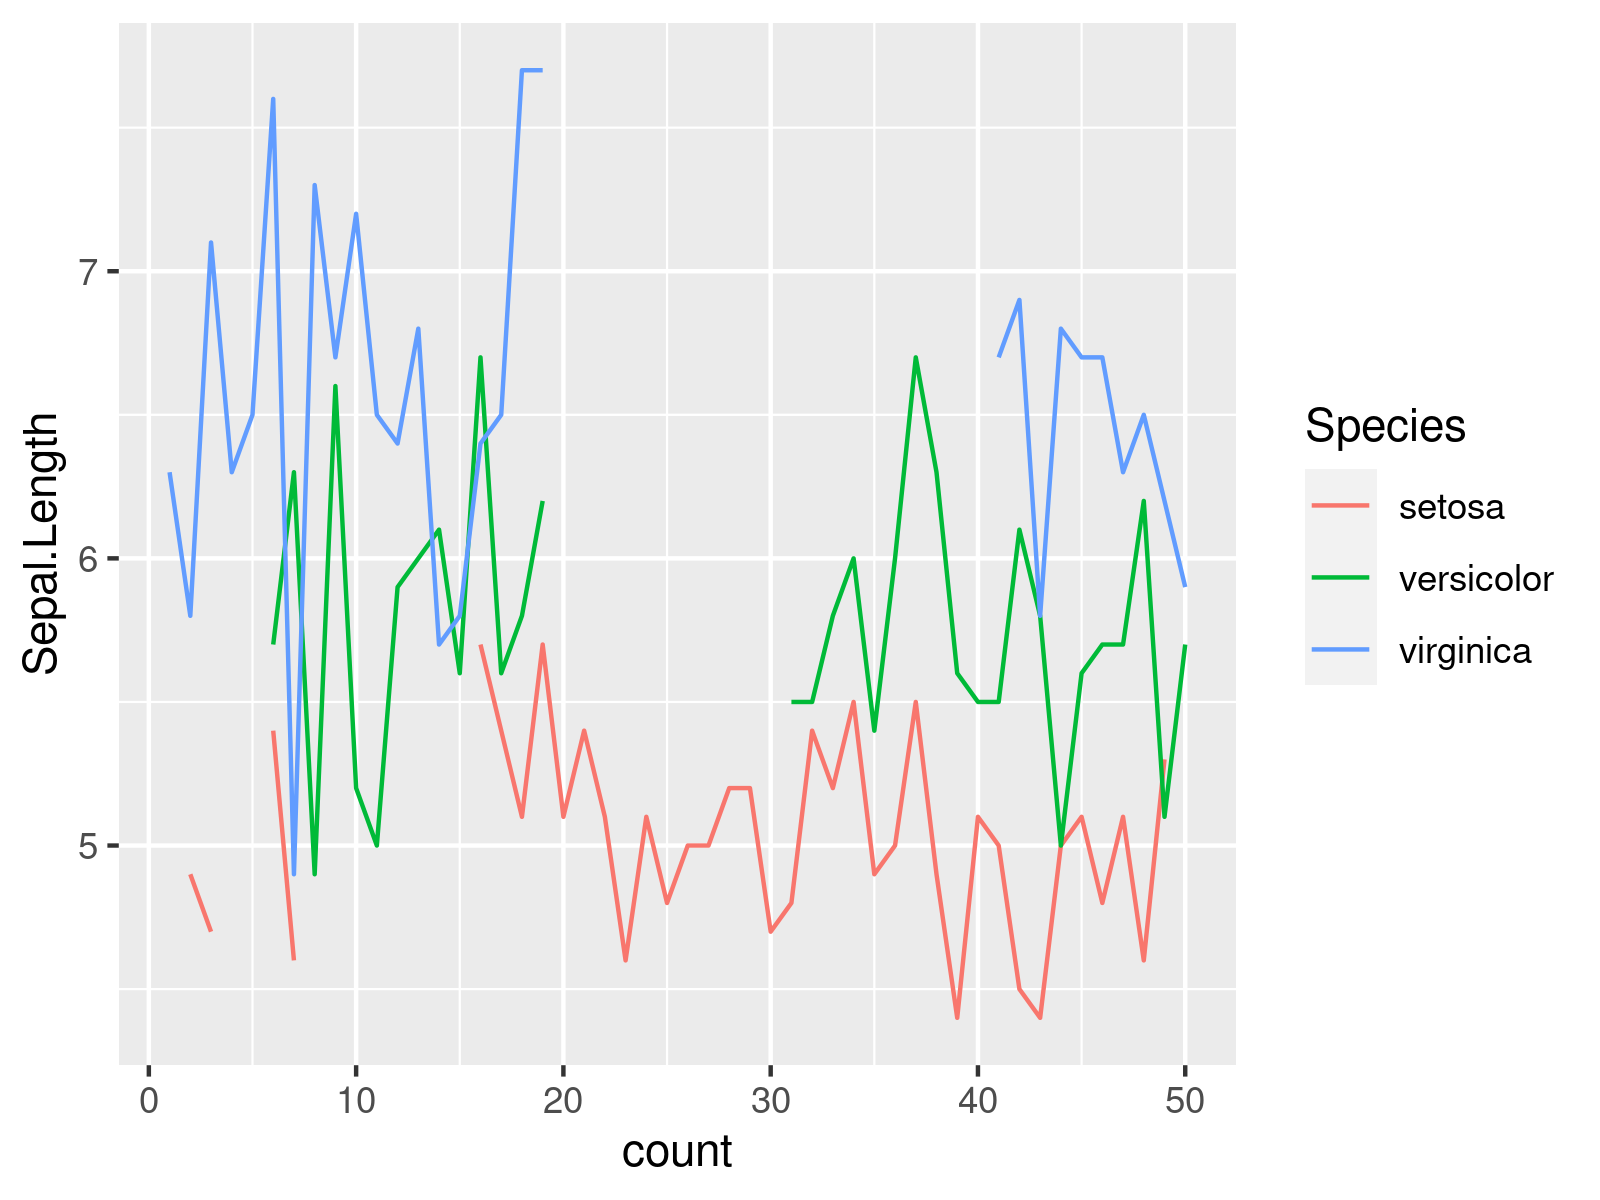
ggplot(iris_NA, # Drawing ggplot2 plot of all data aes(x = count, y = Sepal.Length, col = Species)) + geom_line() |
ggplot(iris_NA, # Drawing ggplot2 plot of all data aes(x = count, y = Sepal.Length, col = Species)) + geom_line()

Example: How to Connect Lines in ggplot2 Line Graph with Missing Values
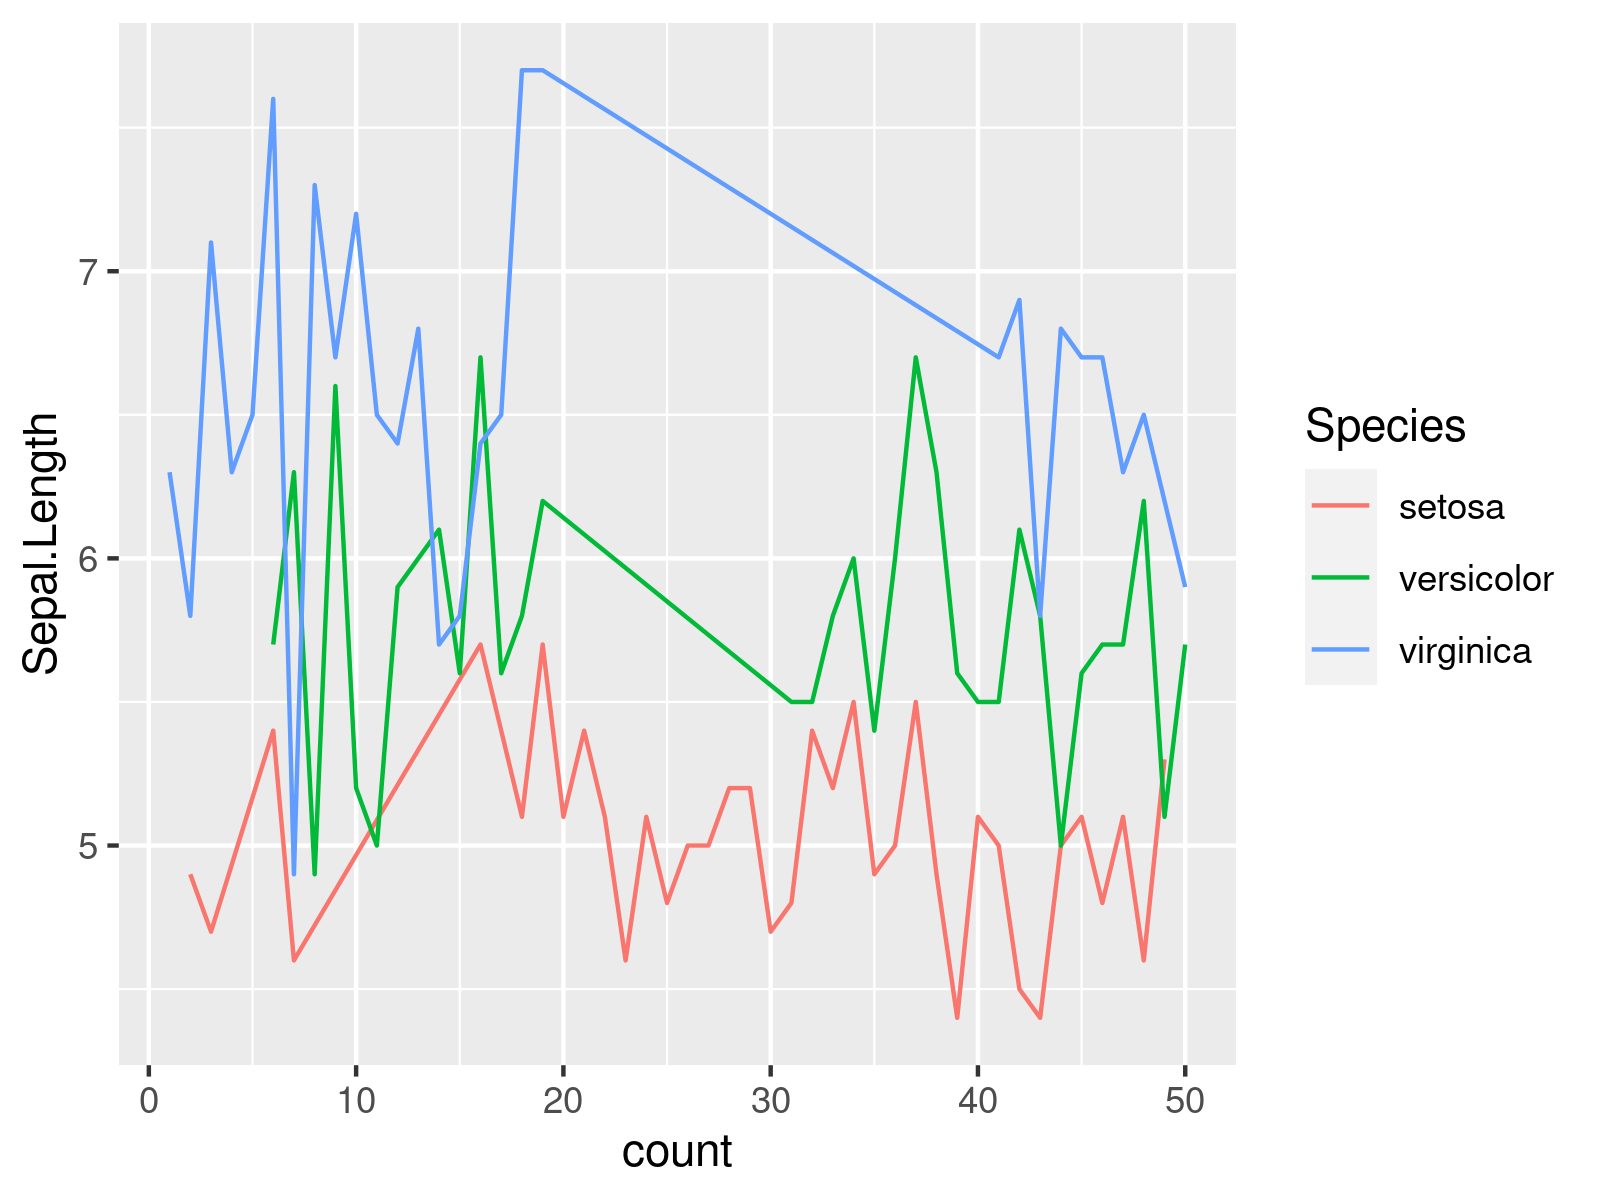
ggplot(iris_NA[!is.na(iris_NA$Sepal.Length), ], # Using only observed cases to draw plot aes(x = count, y = Sepal.Length, col = Species)) + geom_line() |
ggplot(iris_NA[!is.na(iris_NA$Sepal.Length), ], # Using only observed cases to draw plot aes(x = count, y = Sepal.Length, col = Species)) + geom_line()

Related Articles & Further Resources
Please find some additional R tutorials on topics such as plot legends, graphics in R, and regression models below.
- Set Fixed Continuous Colour Values in ggplot2 Plot
- How to Add Lines & Points to a ggplot2 Plot
- How to Change Line Color & Type in Legend of ggplot2 Plot
- Drawing Predicted vs. Observed Values in ggplot2 Plot
- Get Fitted Values of Regression Line from ggplot2 Plot
- Eliminate Missing Values Before Drawing ggplot2 Plot
