R Stacked Barchart where Each Bar is Scaled to 100% (Example Code)
In this article, I’ll illustrate how to create a stacked barchart where each bar is scaled to 100 percent in the R programming language.
Setting up the Example
set.seed(3012983) # Constructing data frame my_df <- data.frame(main = rep(LETTERS[1:4], each = 10), sub = letters[1:10], values = round(runif(40, 1, 10), 0)) my_df # Printing data frame to RStudio console |
set.seed(3012983) # Constructing data frame my_df <- data.frame(main = rep(LETTERS[1:4], each = 10), sub = letters[1:10], values = round(runif(40, 1, 10), 0)) my_df # Printing data frame to RStudio console
install.packages("ggplot2") # Install ggplot2 package library("ggplot2") # Load ggplot2 package |
install.packages("ggplot2") # Install ggplot2 package library("ggplot2") # Load ggplot2 package
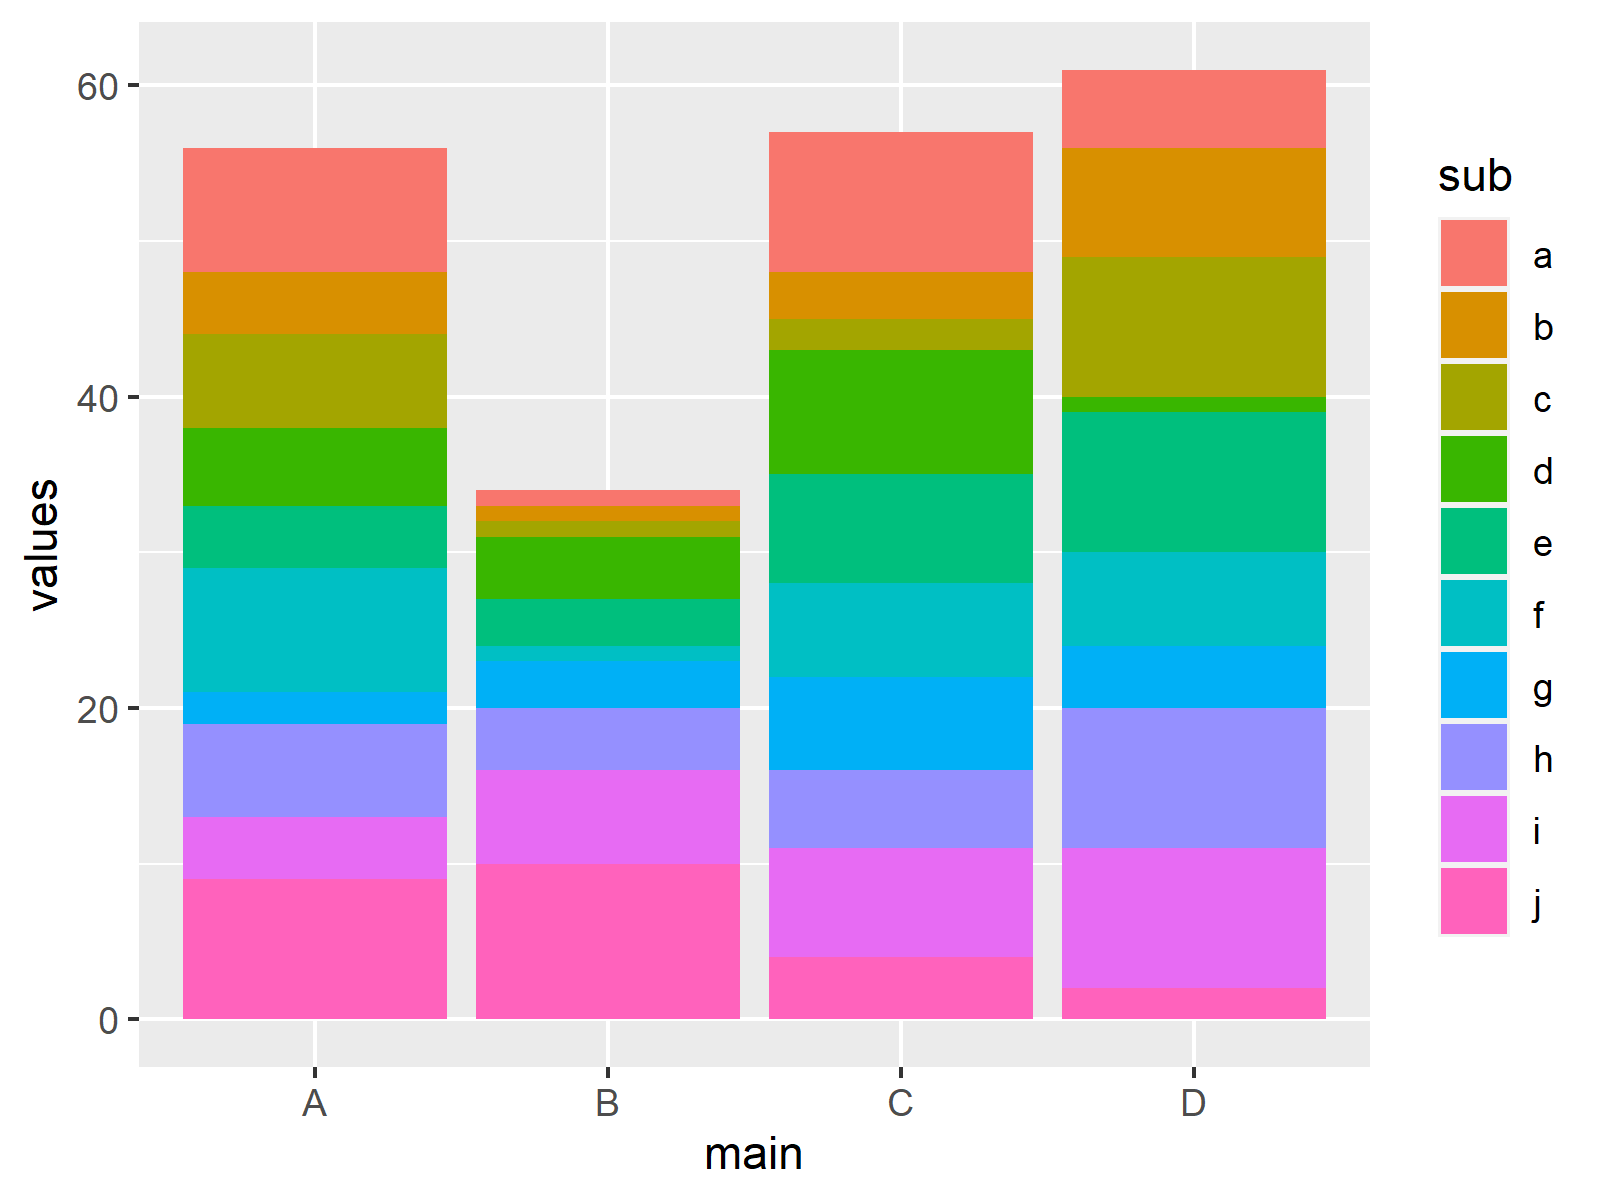
ggplot(my_df, # Drawing stacked ggplot2 barplot aes(x = main, y = values, fill = sub)) + geom_bar(stat = "identity") |
ggplot(my_df, # Drawing stacked ggplot2 barplot aes(x = main, y = values, fill = sub)) + geom_bar(stat = "identity")

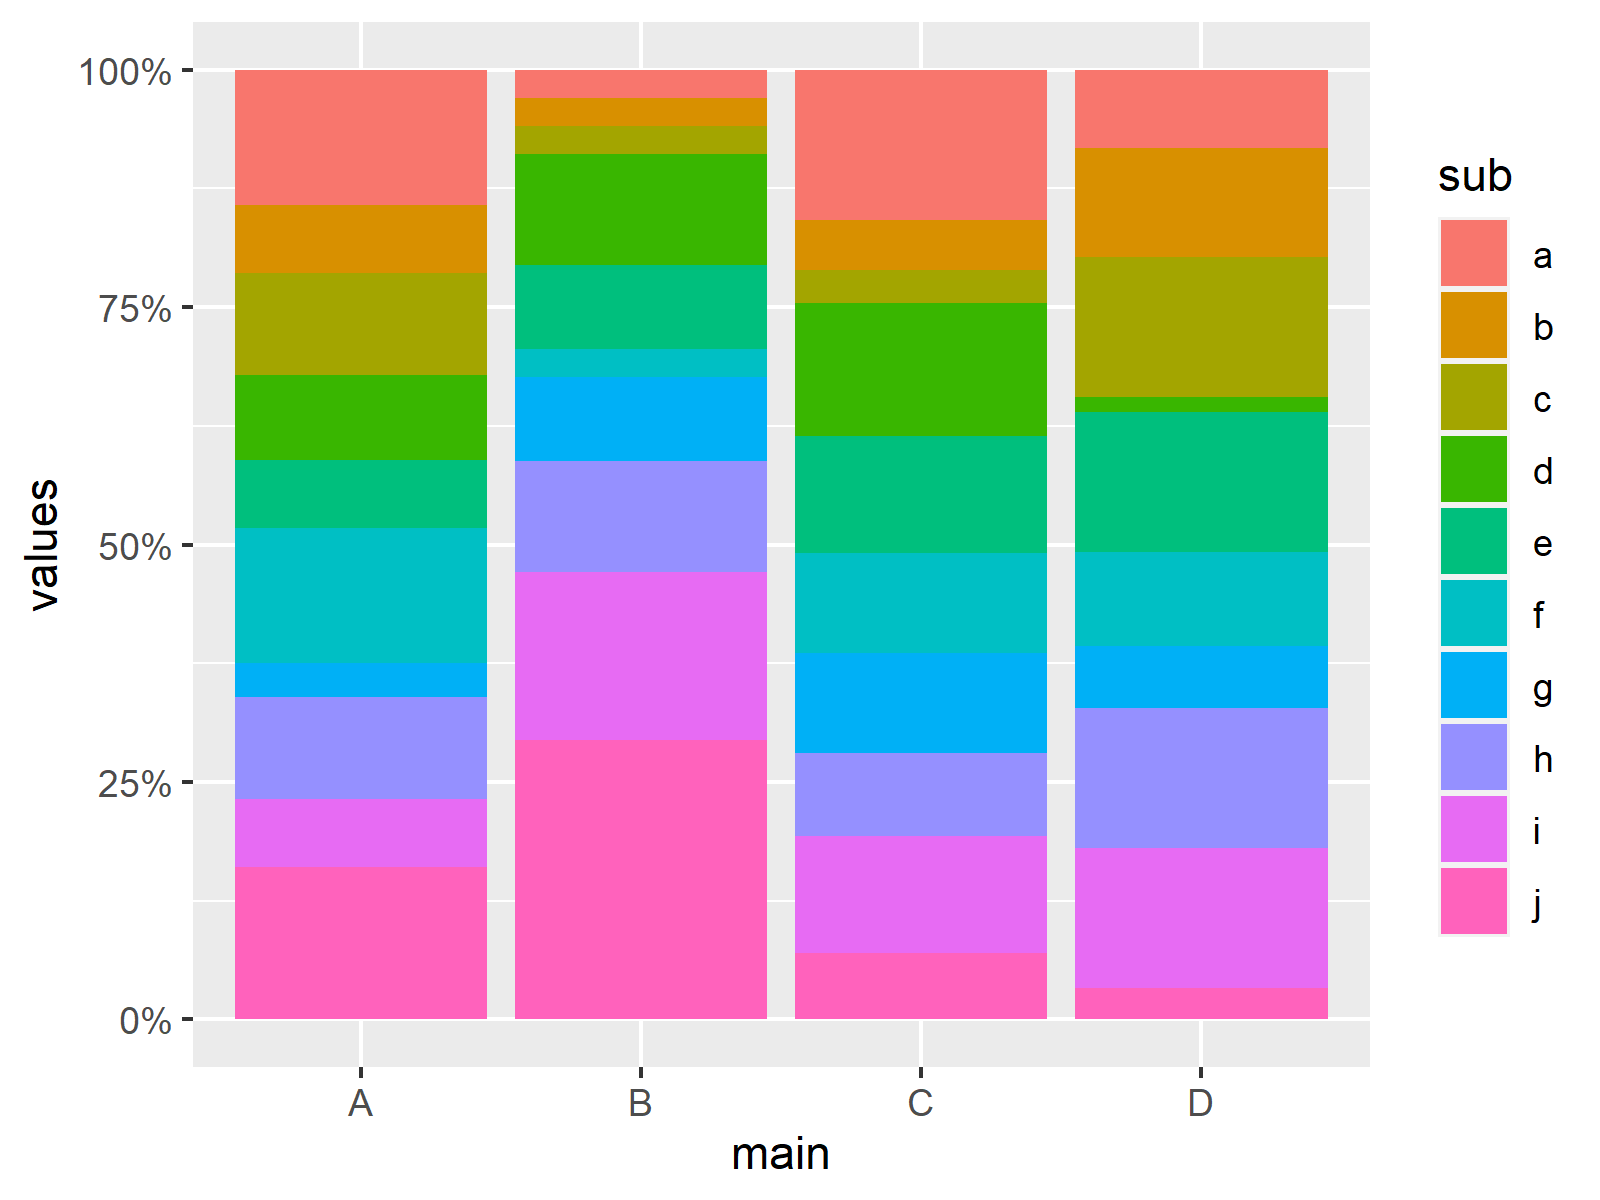
Example: Creating Stacked Barplot where Each Stack is Scaled to 100%
ggplot(my_df, # Drawing barplot scaled to 100% aes(x = main, y = values, fill = sub)) + geom_bar(stat = "identity", position = "fill") + scale_y_continuous(labels = scales::percent_format()) |
ggplot(my_df, # Drawing barplot scaled to 100% aes(x = main, y = values, fill = sub)) + geom_bar(stat = "identity", position = "fill") + scale_y_continuous(labels = scales::percent_format())

