Polygon Plot in R (2 Examples)
This article explains how to draw a polygon plot in the R programming language.
Example 1: Square Polygon
First, we need to draw an empty plot in R:
plot(10, 10, # Create empty plot xlim = c(0, 20), ylim = c(0, 20), col = "white", xlab = "X", ylab = "Y") |
plot(10, 10, # Create empty plot xlim = c(0, 20), ylim = c(0, 20), col = "white", xlab = "X", ylab = "Y")
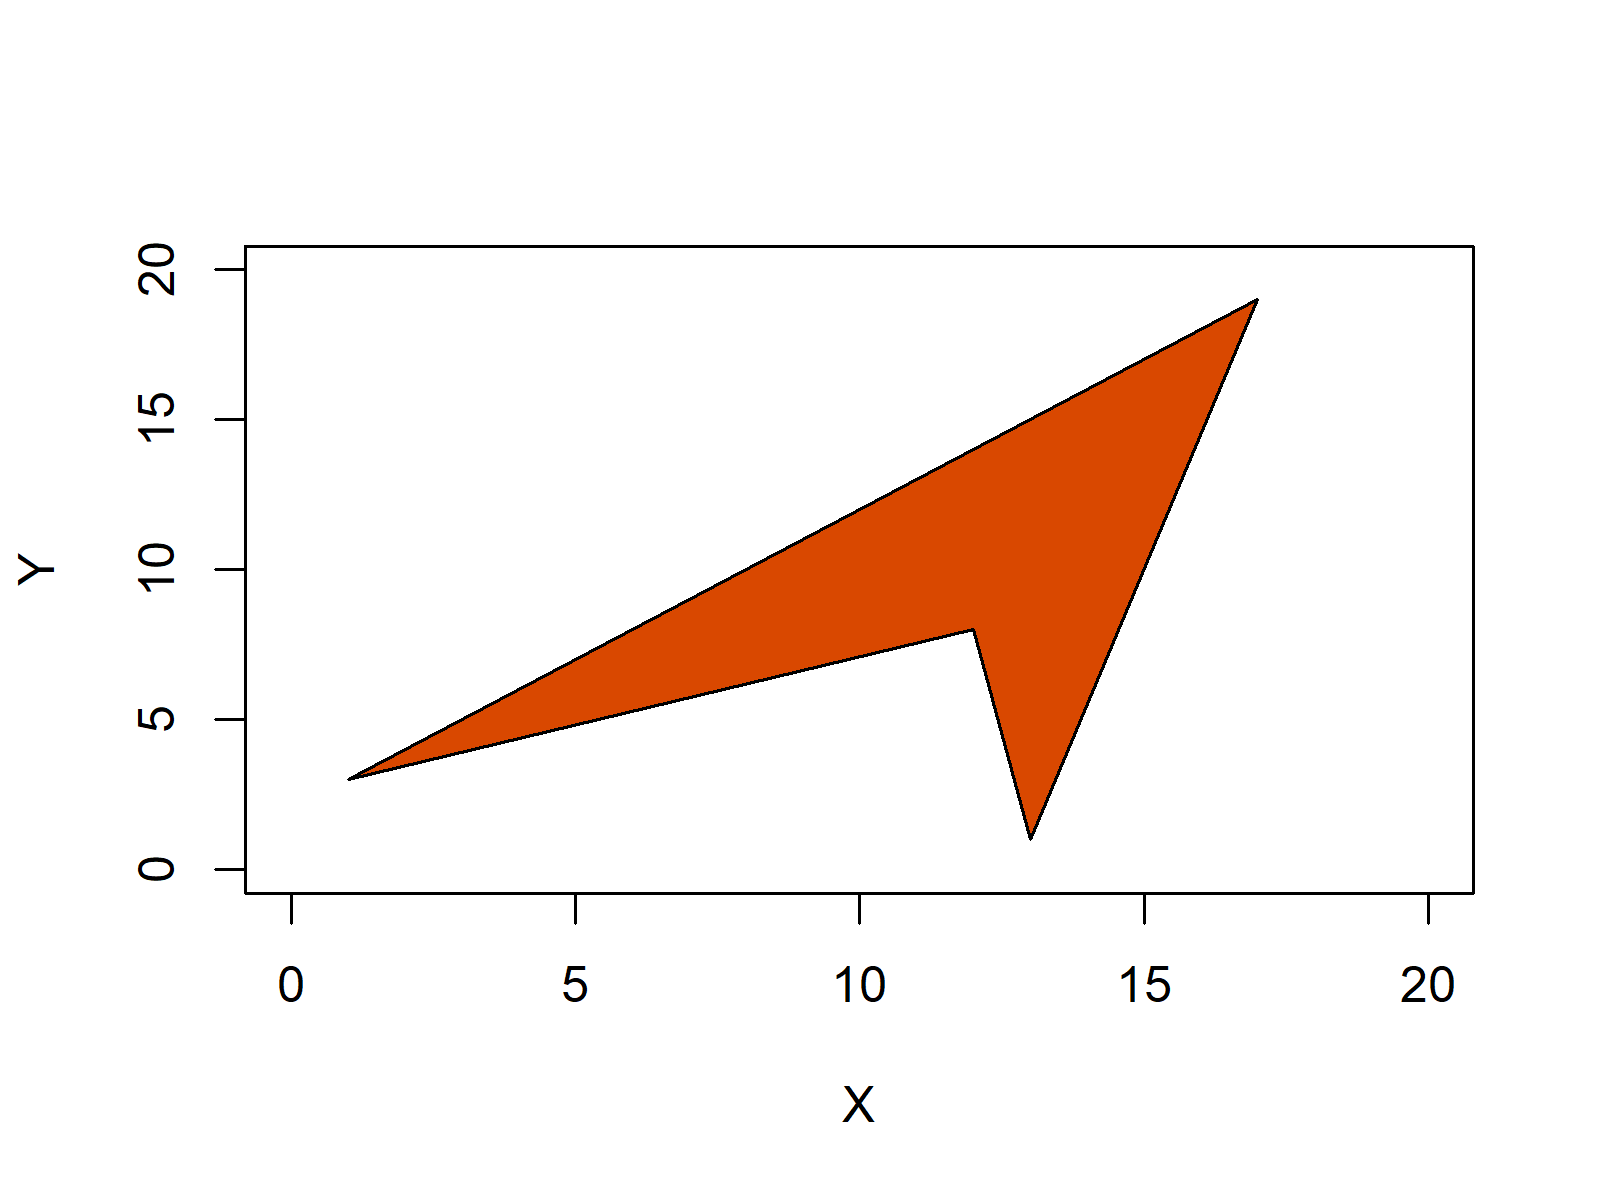
Then, we can specify the coordinates and draw a squared polygon as follows:
polygon(x = c(1, 17, 13, 12), # X-Coordinates of square polygon y = c(3, 19, 1, 8), # Y-Coordinates of square polygon col = "#d94800") # Color of square polygon |
polygon(x = c(1, 17, 13, 12), # X-Coordinates of square polygon y = c(3, 19, 1, 8), # Y-Coordinates of square polygon col = "#d94800") # Color of square polygon

Example 2: Density Polygon
We can also draw a polygon below a density plot. First, we need to create some example data for the density:
set.seed(12345) # Set seed x <- rnorm(50) # Draw random normal distribution |
set.seed(12345) # Set seed x <- rnorm(50) # Draw random normal distribution
Then, we need to draw an empty plot (as in Example 1):
plot(density(x), main = "") # Draw density plot |
plot(density(x), main = "") # Draw density plot
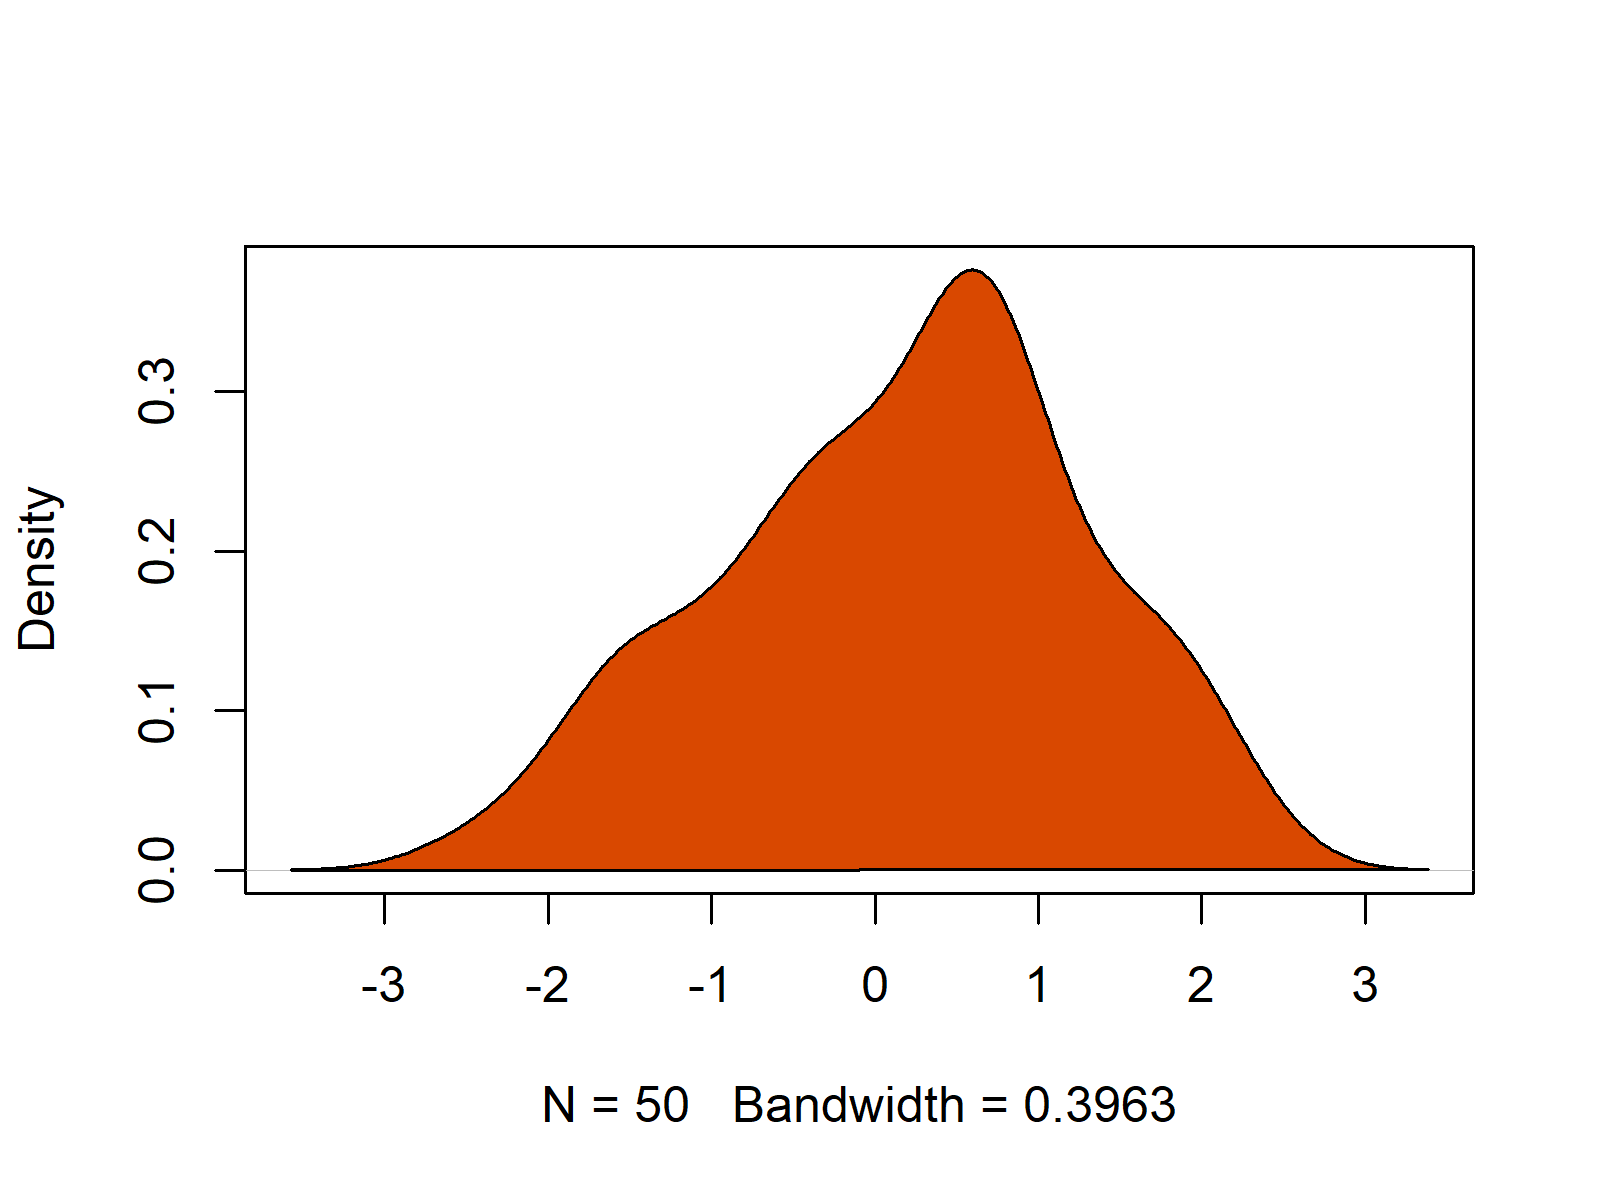
Finally, we can draw our density polygon:
polygon(c(min(density(x)$x), density(x)$x), # X-Coordinates of density polygon c(0, density(x)$y), # Y-Coordinates of density polygon col = "#d94800") # Color of density polygon |
polygon(c(min(density(x)$x), density(x)$x), # X-Coordinates of density polygon c(0, density(x)$y), # Y-Coordinates of density polygon col = "#d94800") # Color of density polygon

