R Plotting Categories of Variable with % Instead of Counts (2 Examples)
This article shows how to draw categories of a variable with percentage points on the y-axis in R.
Preparing the Examples
set.seed(6546654) # Drawing random example data df_raw <- data.frame(categories = sample(letters[1:3], 15, replace = TRUE)) df_raw # Show example data in console # categories # 1 a # 2 a # 3 c # 4 b # 5 a # 6 a # 7 b # 8 a # 9 a # 10 b # 11 b # 12 c # 13 b # 14 a # 15 b |
set.seed(6546654) # Drawing random example data df_raw <- data.frame(categories = sample(letters[1:3], 15, replace = TRUE)) df_raw # Show example data in console # categories # 1 a # 2 a # 3 c # 4 b # 5 a # 6 a # 7 b # 8 a # 9 a # 10 b # 11 b # 12 c # 13 b # 14 a # 15 b
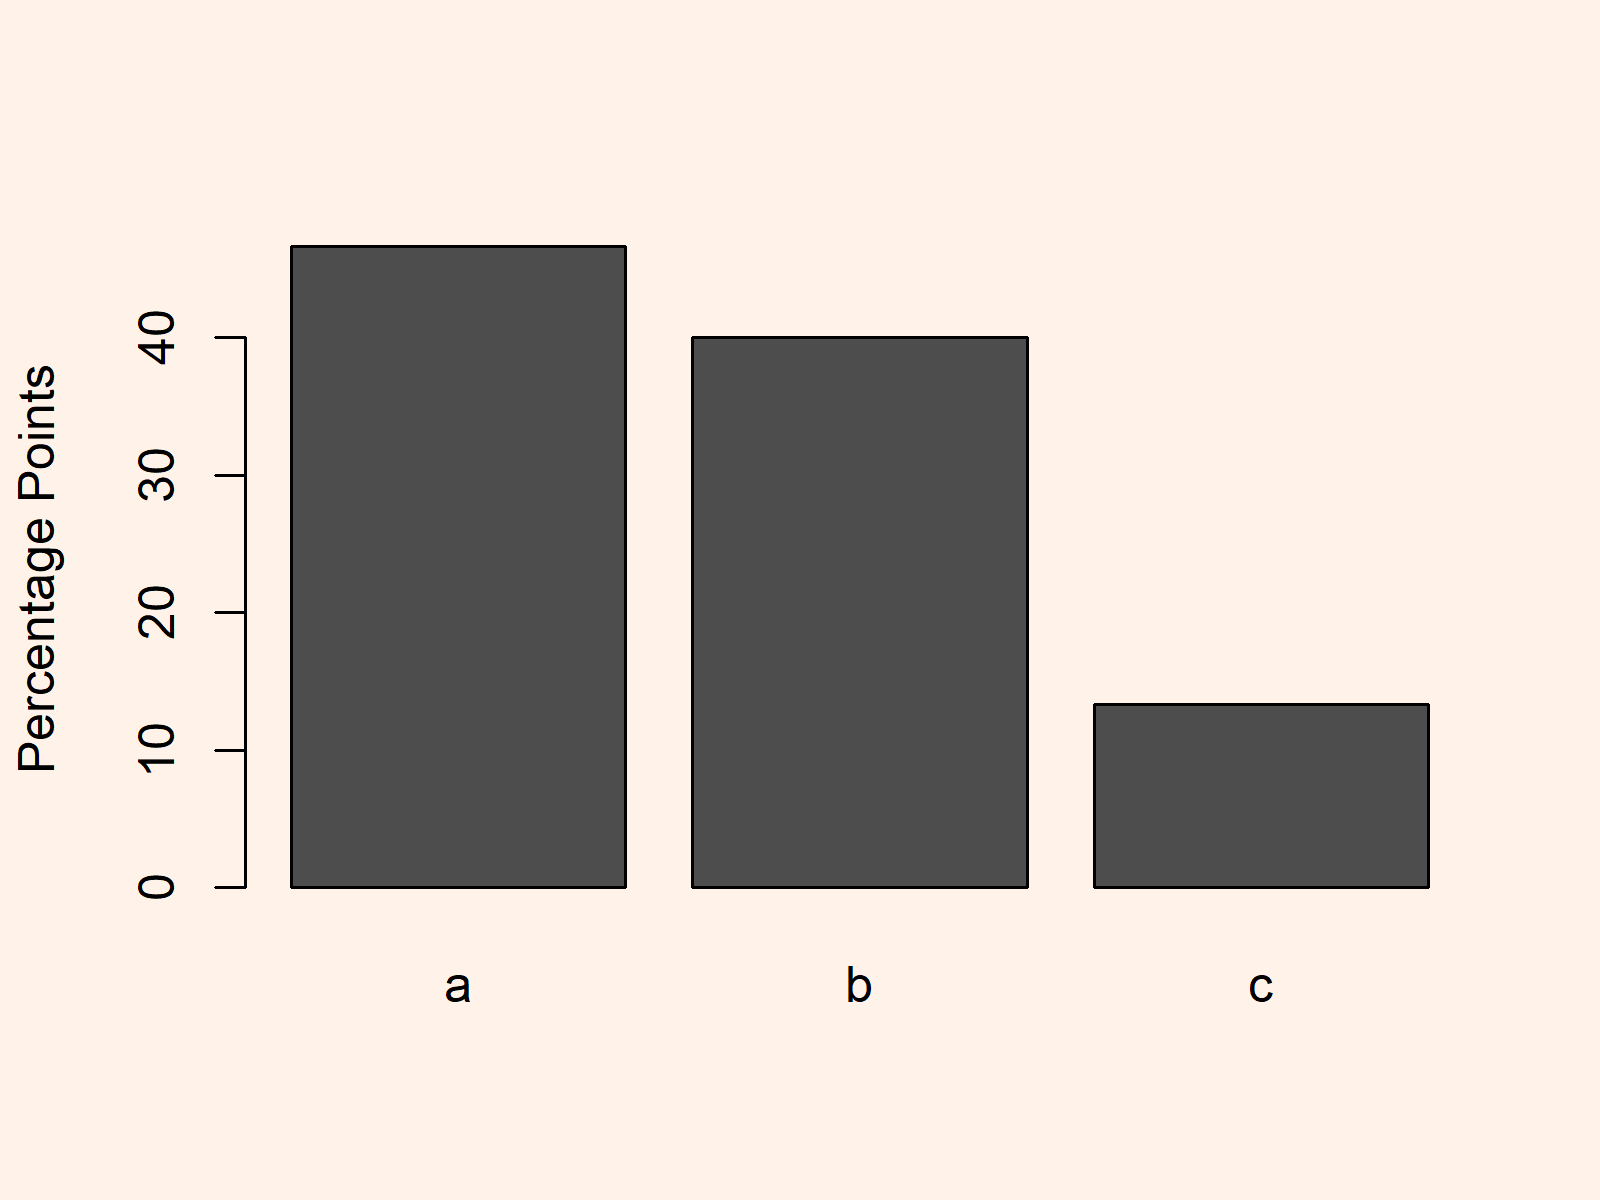
Example 1: Base R Barchart with Percentage Points on Y-Axis
df_percentage <- 100 * # Modify data frame t( prop.table( table( df_raw$categories))) |
df_percentage <- 100 * # Modify data frame t( prop.table( table( df_raw$categories)))
barplot(df_percentage, # Draw Base R plot ylab = "Percentage Points") |
barplot(df_percentage, # Draw Base R plot ylab = "Percentage Points")

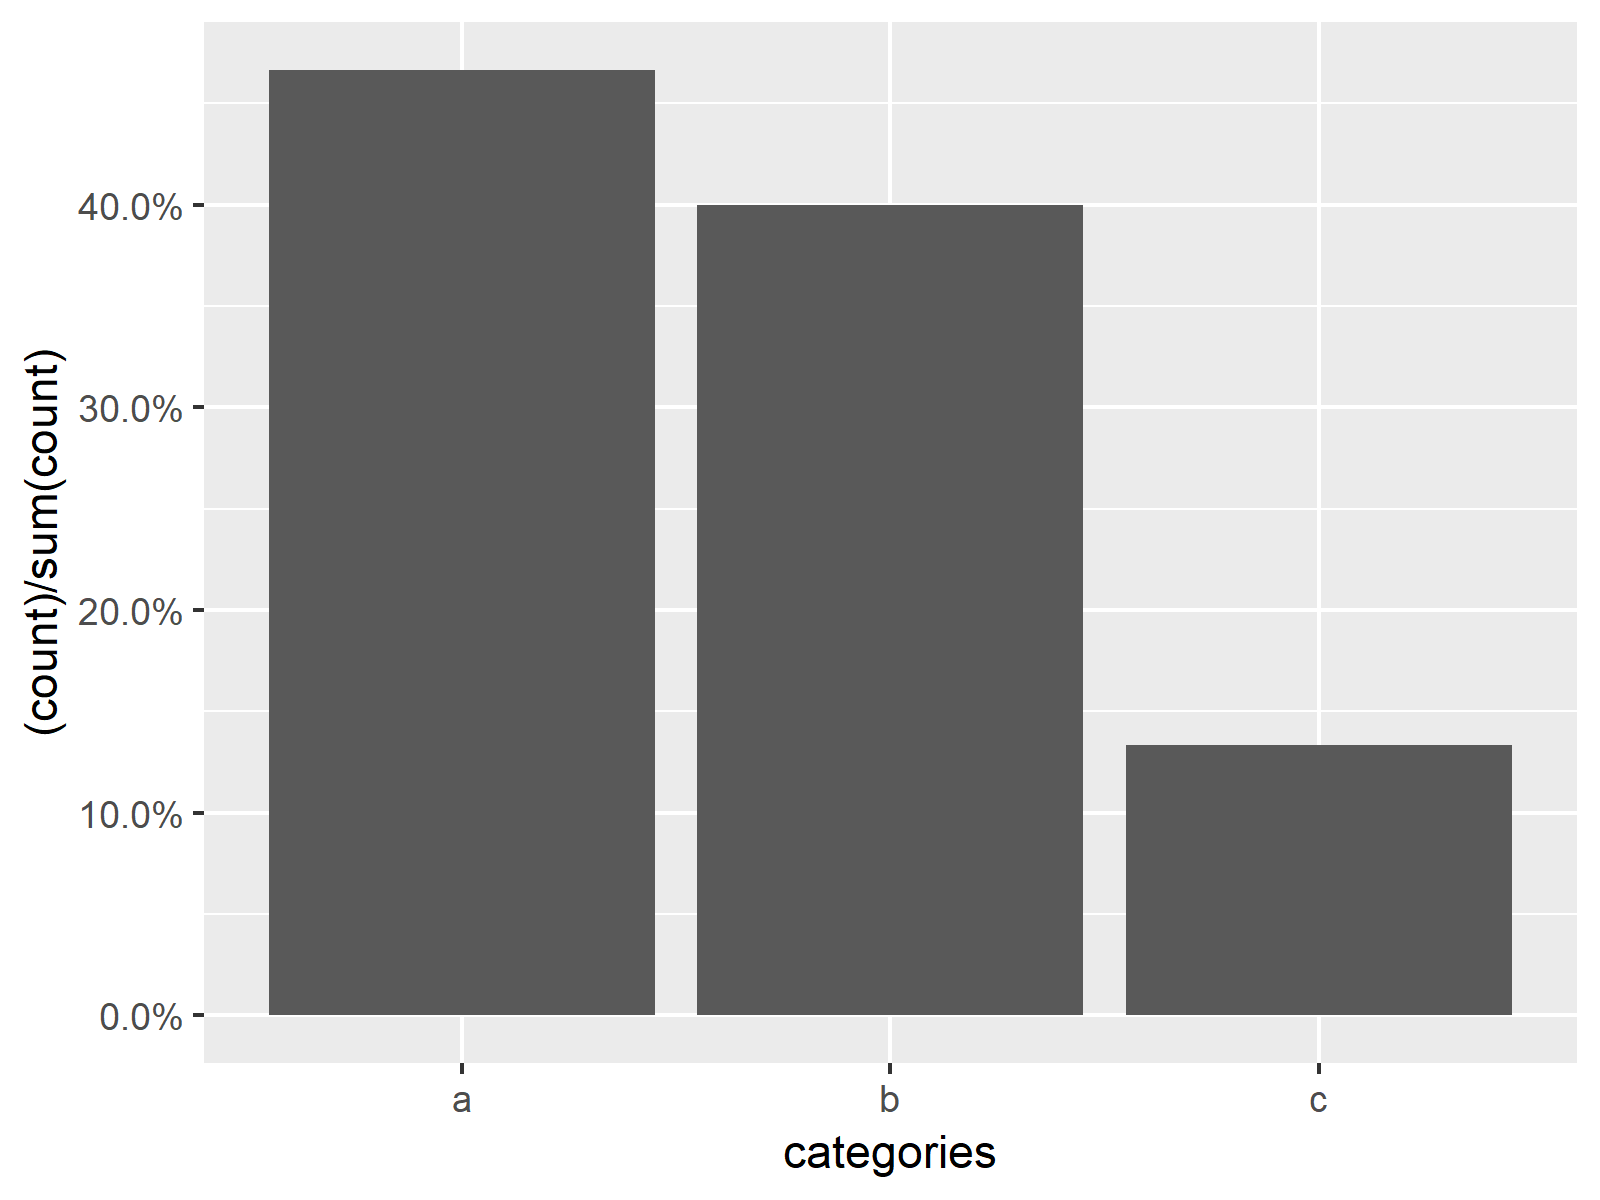
Example 2: ggplot2 Barchart with Percentage Points on Y-Axis
install.packages("ggplot2") # Install ggplot2 package library("ggplot2") # Load ggplot2 package |
install.packages("ggplot2") # Install ggplot2 package library("ggplot2") # Load ggplot2 package
install.packages("scales") # Install scales package library("scales") # Load scales package |
install.packages("scales") # Install scales package library("scales") # Load scales package
ggplot(df_raw, aes(categories)) + # Barchart using ggplot2 framework geom_bar(aes(y = (..count..)/sum(..count..))) + scale_y_continuous(labels = percent) |
ggplot(df_raw, aes(categories)) + # Barchart using ggplot2 framework geom_bar(aes(y = (..count..)/sum(..count..))) + scale_y_continuous(labels = percent)

