R Move ggplot2 Legend with Two Rows to the Bottom (Example Code)
In this R tutorial you’ll learn how to create a ggplot2 graph legend with multiple rows at the bottom of a plot.
Preparing the Example
data(iris) # Load iris data set for the example head(iris) # Sepal.Length Sepal.Width Petal.Length Petal.Width Species # 1 5.1 3.5 1.4 0.2 setosa # 2 4.9 3.0 1.4 0.2 setosa # 3 4.7 3.2 1.3 0.2 setosa # 4 4.6 3.1 1.5 0.2 setosa # 5 5.0 3.6 1.4 0.2 setosa # 6 5.4 3.9 1.7 0.4 setosa |
data(iris) # Load iris data set for the example head(iris) # Sepal.Length Sepal.Width Petal.Length Petal.Width Species # 1 5.1 3.5 1.4 0.2 setosa # 2 4.9 3.0 1.4 0.2 setosa # 3 4.7 3.2 1.3 0.2 setosa # 4 4.6 3.1 1.5 0.2 setosa # 5 5.0 3.6 1.4 0.2 setosa # 6 5.4 3.9 1.7 0.4 setosa
install.packages("ggplot2") # Install & load ggplot2 library("ggplot2") |
install.packages("ggplot2") # Install & load ggplot2 library("ggplot2")
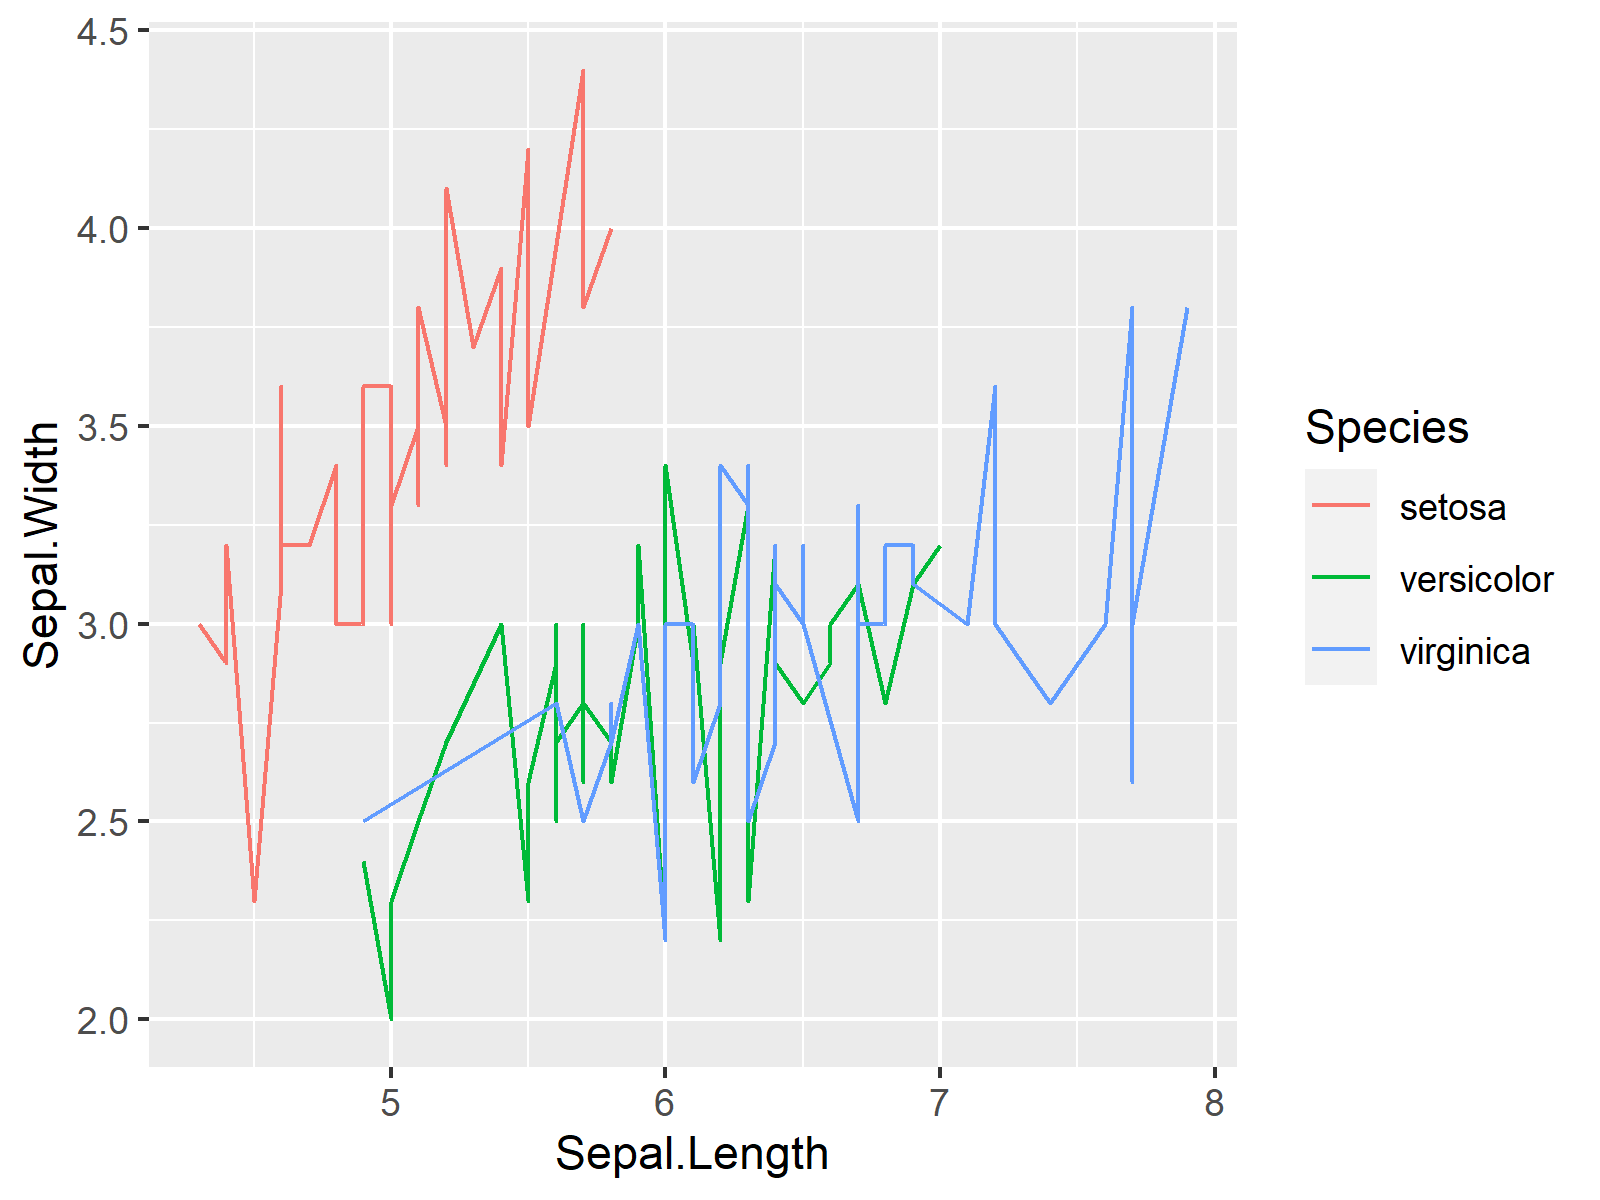
my_plot <- ggplot(iris, # Default ggplot2 legend aes(x = Sepal.Length, y = Sepal.Width, color = Species)) + geom_line() my_plot |
my_plot <- ggplot(iris, # Default ggplot2 legend aes(x = Sepal.Length, y = Sepal.Width, color = Species)) + geom_line() my_plot

Example: Create ggplot2 Legend at the Bottom with Multiple Rows Using guide_legend Function
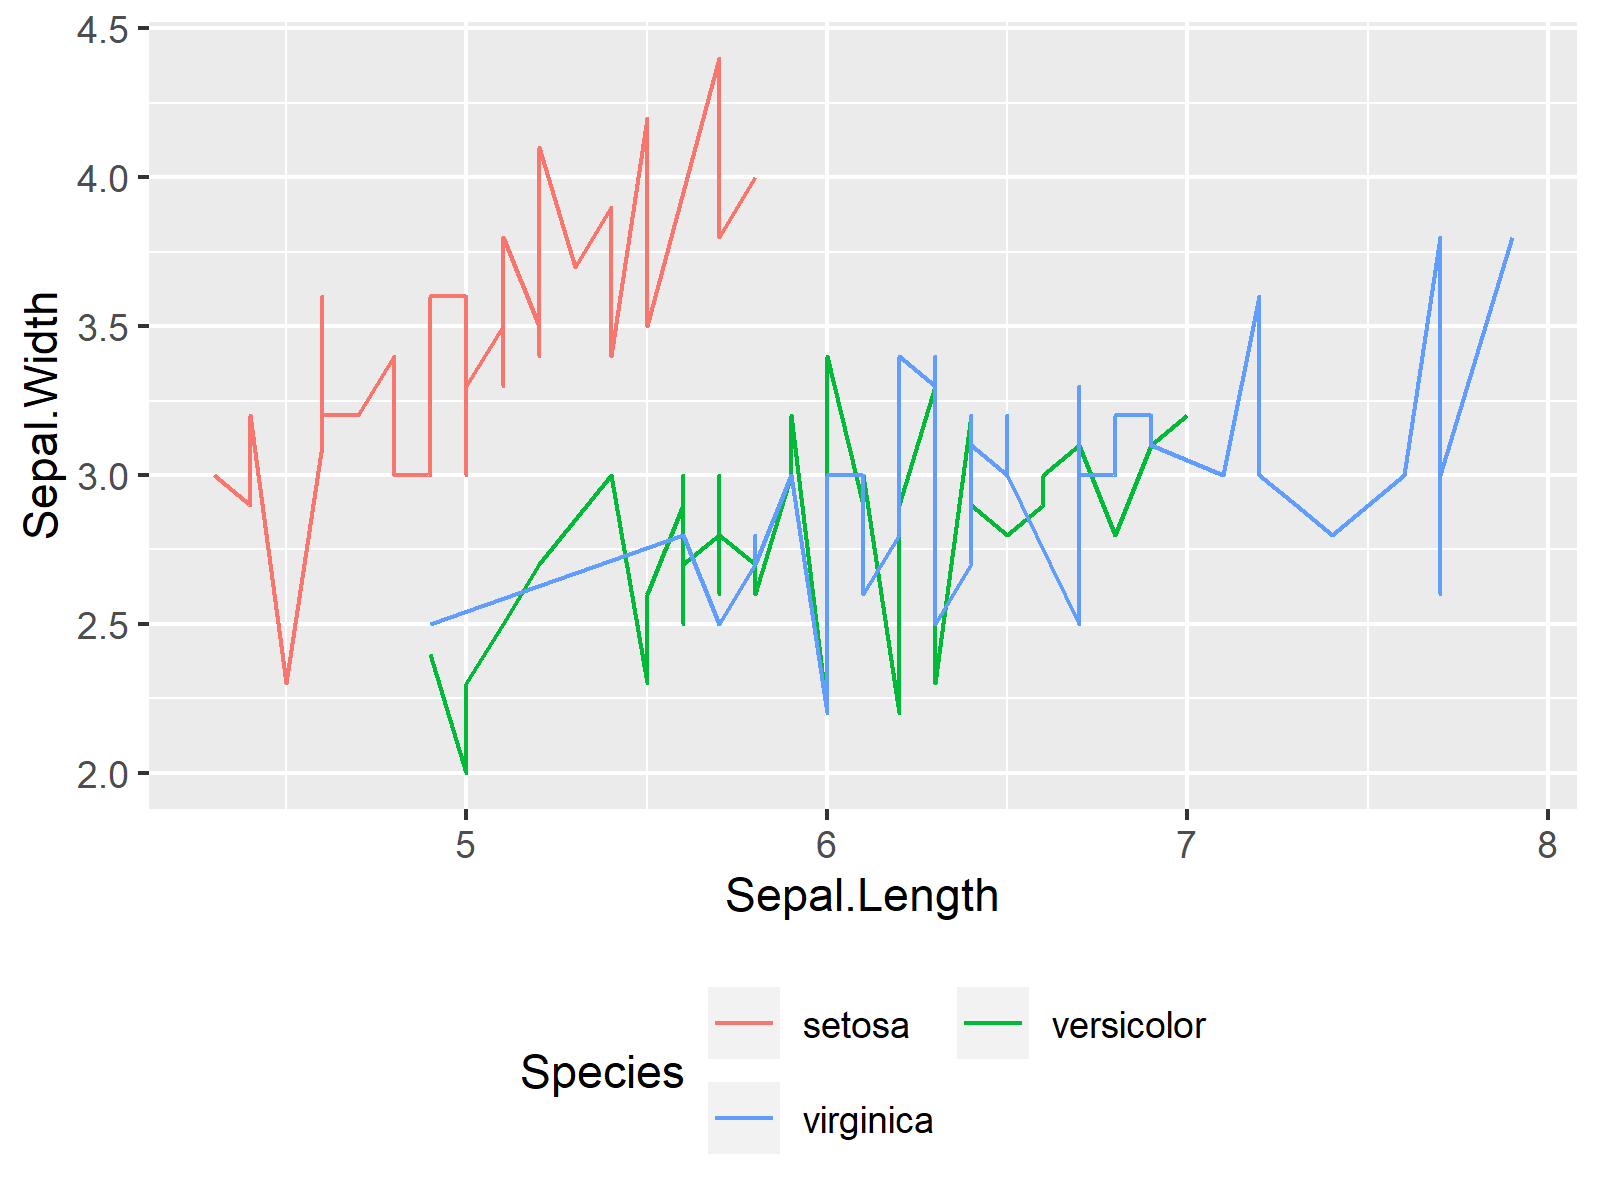
my_plot + # ggplot2 legend at the bottom with two rows theme(legend.position = "bottom") + guides(color = guide_legend(nrow = 2, byrow = TRUE)) |
my_plot + # ggplot2 legend at the bottom with two rows theme(legend.position = "bottom") + guides(color = guide_legend(nrow = 2, byrow = TRUE))

Related Tutorials
Have a look at the following R tutorials. They focus on topics such as time objects, graphics in R, and plot legends.
