Adjust Position of ggplot2 Plot Title in R (Example)
The following R code shows how to change the positioning of the title of a ggplot2 plot in the R programming language.
Example Data
my_data <- data.frame(x = 1:10, # Example data y = 1:10) |
Load ggplot2 Package & Create Plot with Default Title
The following R code installs and loads the ggplot2 package:
install.packages("ggplot2") # Install ggplot2 library("ggplot2") # Load ggplot2 |
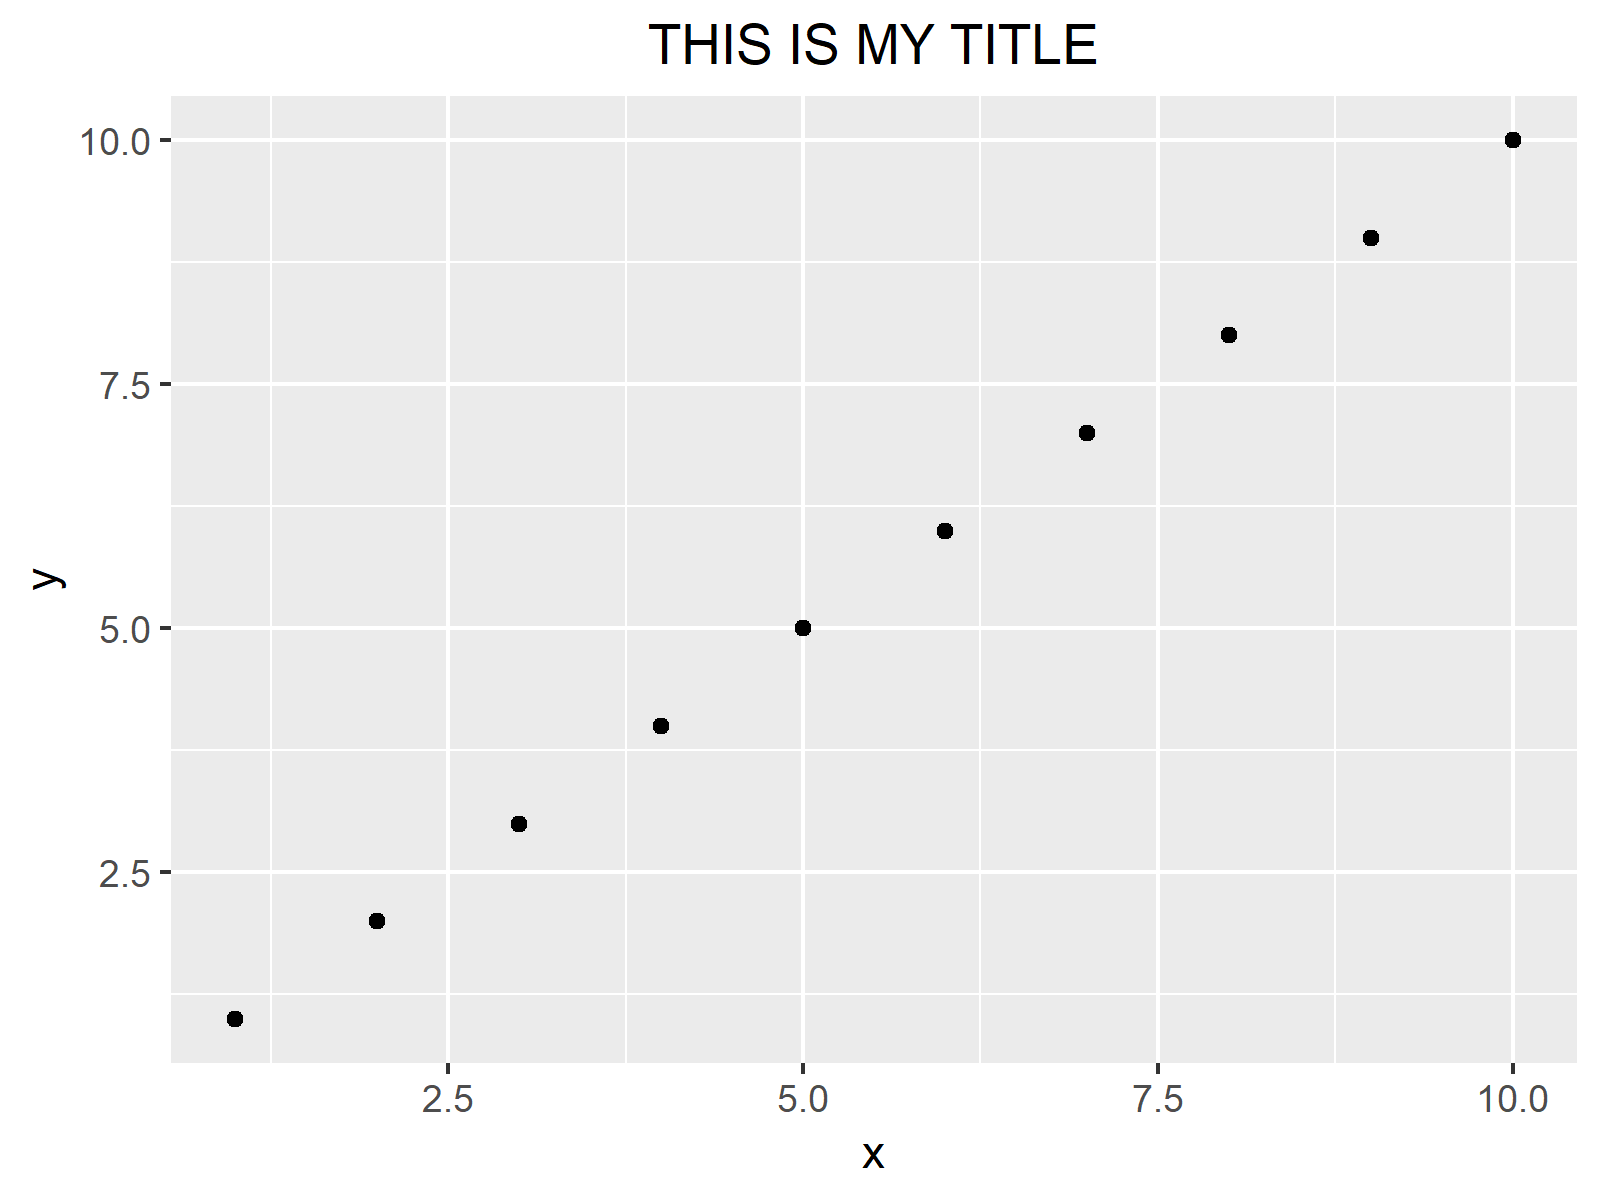
We can draw a basic ggplot2 plot with a title as follows:
my_ggplot <- ggplot(my_data, aes(x, y)) + # ggplot2 with title geom_point(aes(x, y)) + ggtitle("THIS IS MY TITLE") my_ggplot # Print plot |

ggplot2 Plot with Centered Title
my_ggplot + theme(plot.title = element_text(hjust = 0.5)) # Centered title |
ggplot2 Plot with Title on the Right Side
my_ggplot + theme(plot.title = element_text(hjust = 1)) # Right-handed title |

ggplot2 Plot with Title within the Plot Area
my_ggplot + theme(plot.title = element_text(vjust = - 10)) # Vertically adjusted title |
