How to Modify the Text Font of a Graphic in R (3 Examples)
In this tutorial you’ll learn how to select fonts of plots manually in the R programming language.
Setting up the Examples
data(iris) # Loading example data head(iris) # Sepal.Length Sepal.Width Petal.Length Petal.Width Species # 1 5.1 3.5 1.4 0.2 setosa # 2 4.9 3.0 1.4 0.2 setosa # 3 4.7 3.2 1.3 0.2 setosa # 4 4.6 3.1 1.5 0.2 setosa # 5 5.0 3.6 1.4 0.2 setosa # 6 5.4 3.9 1.7 0.4 setosa |
data(iris) # Loading example data head(iris) # Sepal.Length Sepal.Width Petal.Length Petal.Width Species # 1 5.1 3.5 1.4 0.2 setosa # 2 4.9 3.0 1.4 0.2 setosa # 3 4.7 3.2 1.3 0.2 setosa # 4 4.6 3.1 1.5 0.2 setosa # 5 5.0 3.6 1.4 0.2 setosa # 6 5.4 3.9 1.7 0.4 setosa
Example 1: Modify Font in Base R Graph
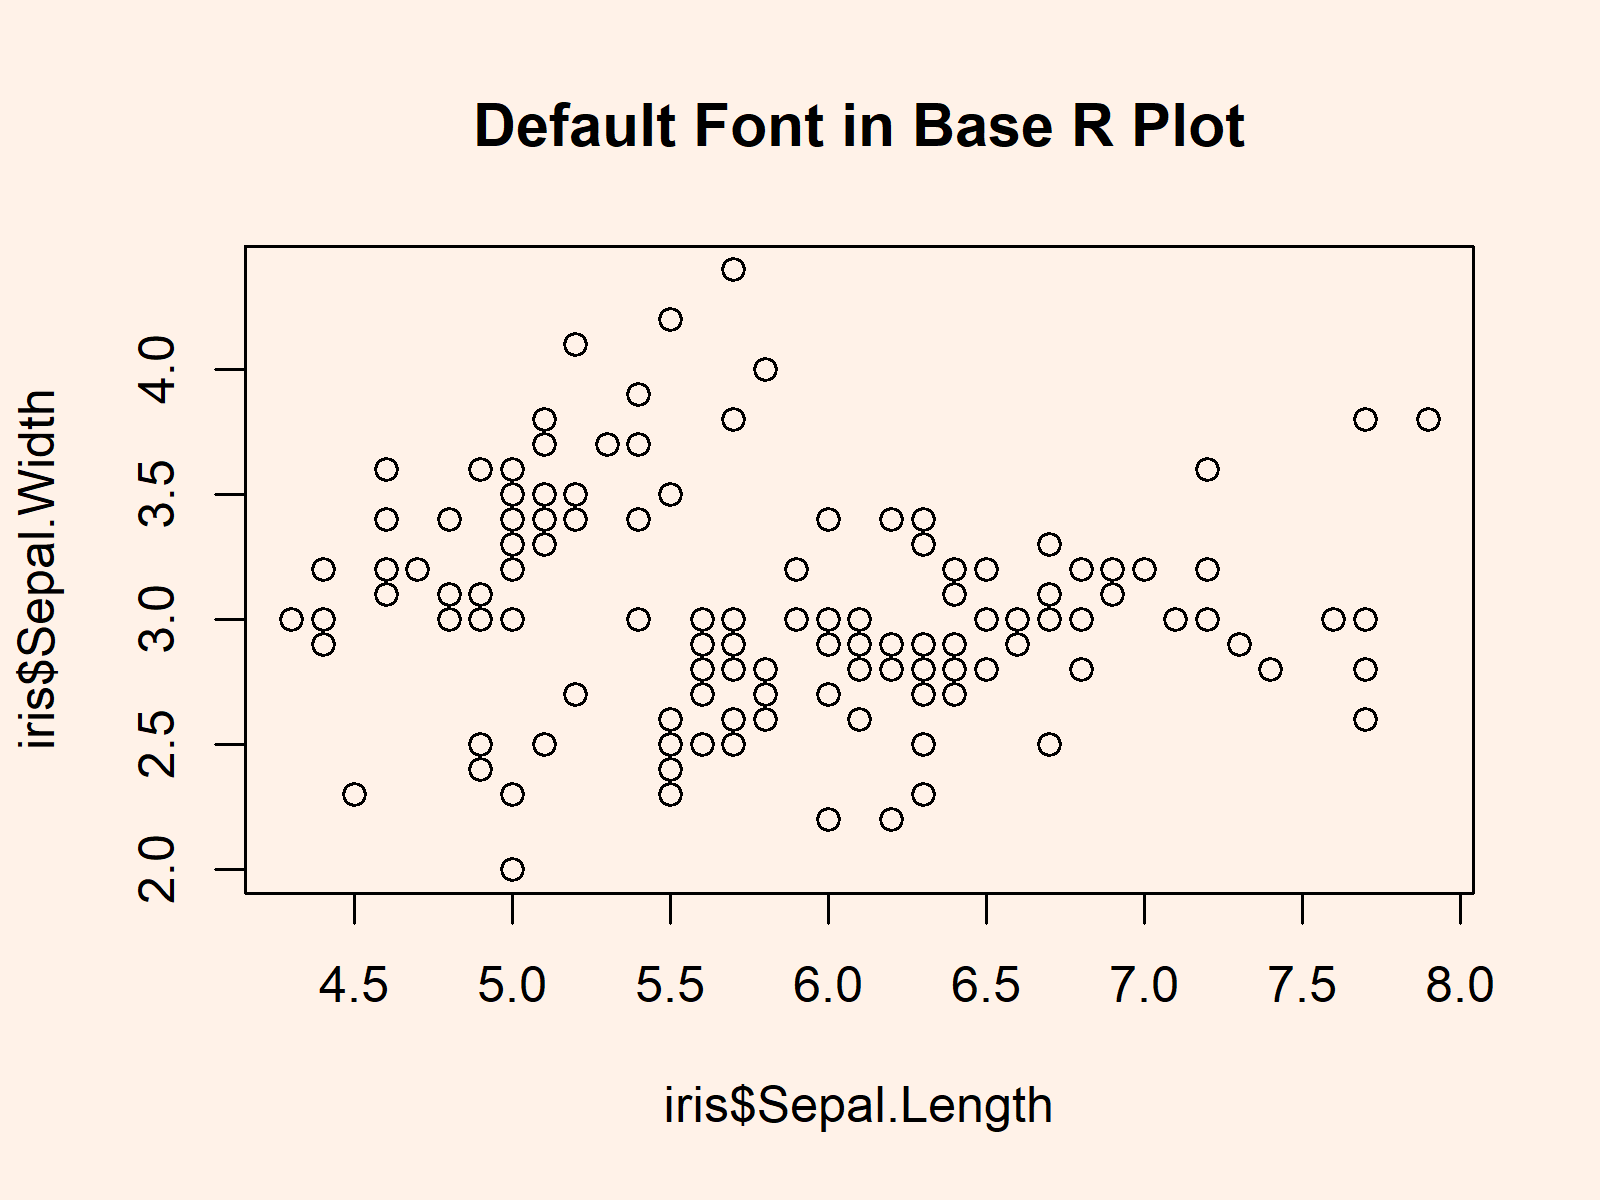
plot(iris$Sepal.Length, # Drawing plot with default font iris$Sepal.Width, main = "Default Font in Base R Plot") |
plot(iris$Sepal.Length, # Drawing plot with default font iris$Sepal.Width, main = "Default Font in Base R Plot")

windowsFonts(my_font = windowsFont("Times New Roman")) # Selecting font manually |
windowsFonts(my_font = windowsFont("Times New Roman")) # Selecting font manually
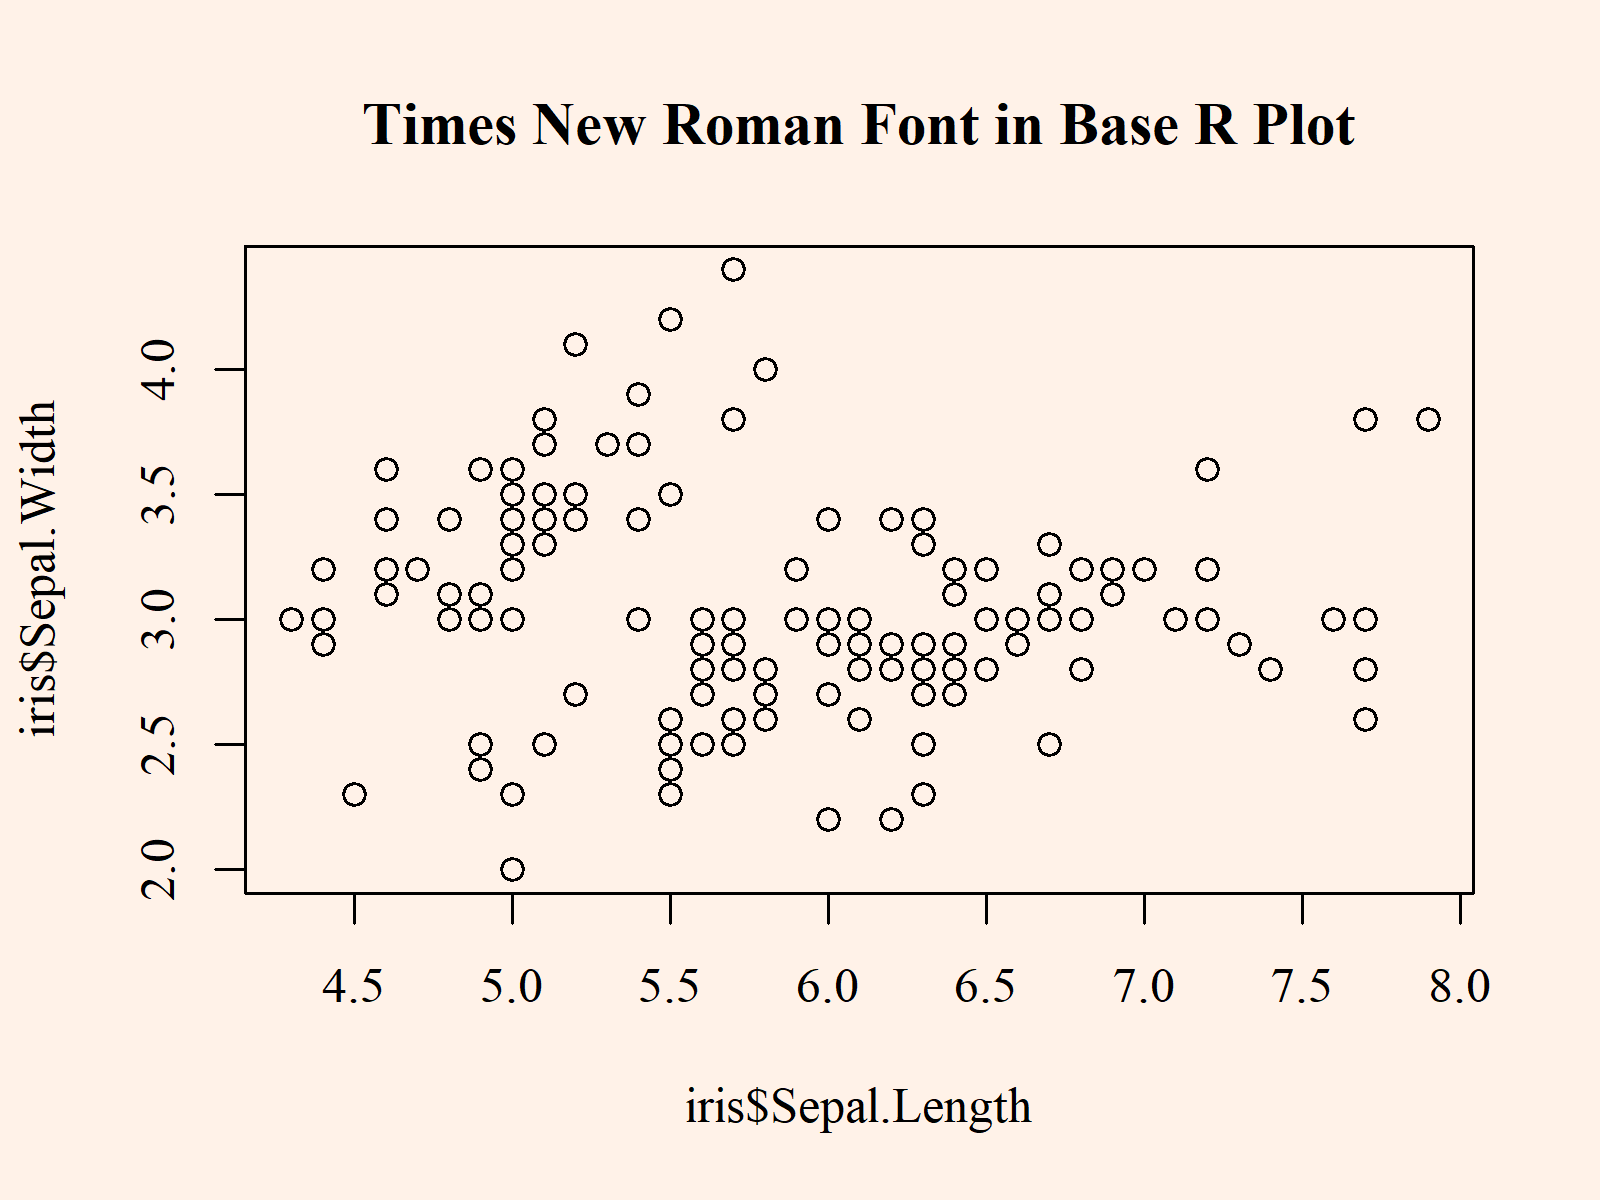
plot(iris$Sepal.Length, # Drawing Base R plot with user-defined font iris$Sepal.Width, main = "Times New Roman Font in Base R Plot", family = "my_font") |
plot(iris$Sepal.Length, # Drawing Base R plot with user-defined font iris$Sepal.Width, main = "Times New Roman Font in Base R Plot", family = "my_font")

Example 2: Modify Font in ggplot2 Graph
install.packages("ggplot2") # Install & load ggplot2 package library("ggplot2") |
install.packages("ggplot2") # Install & load ggplot2 package library("ggplot2")
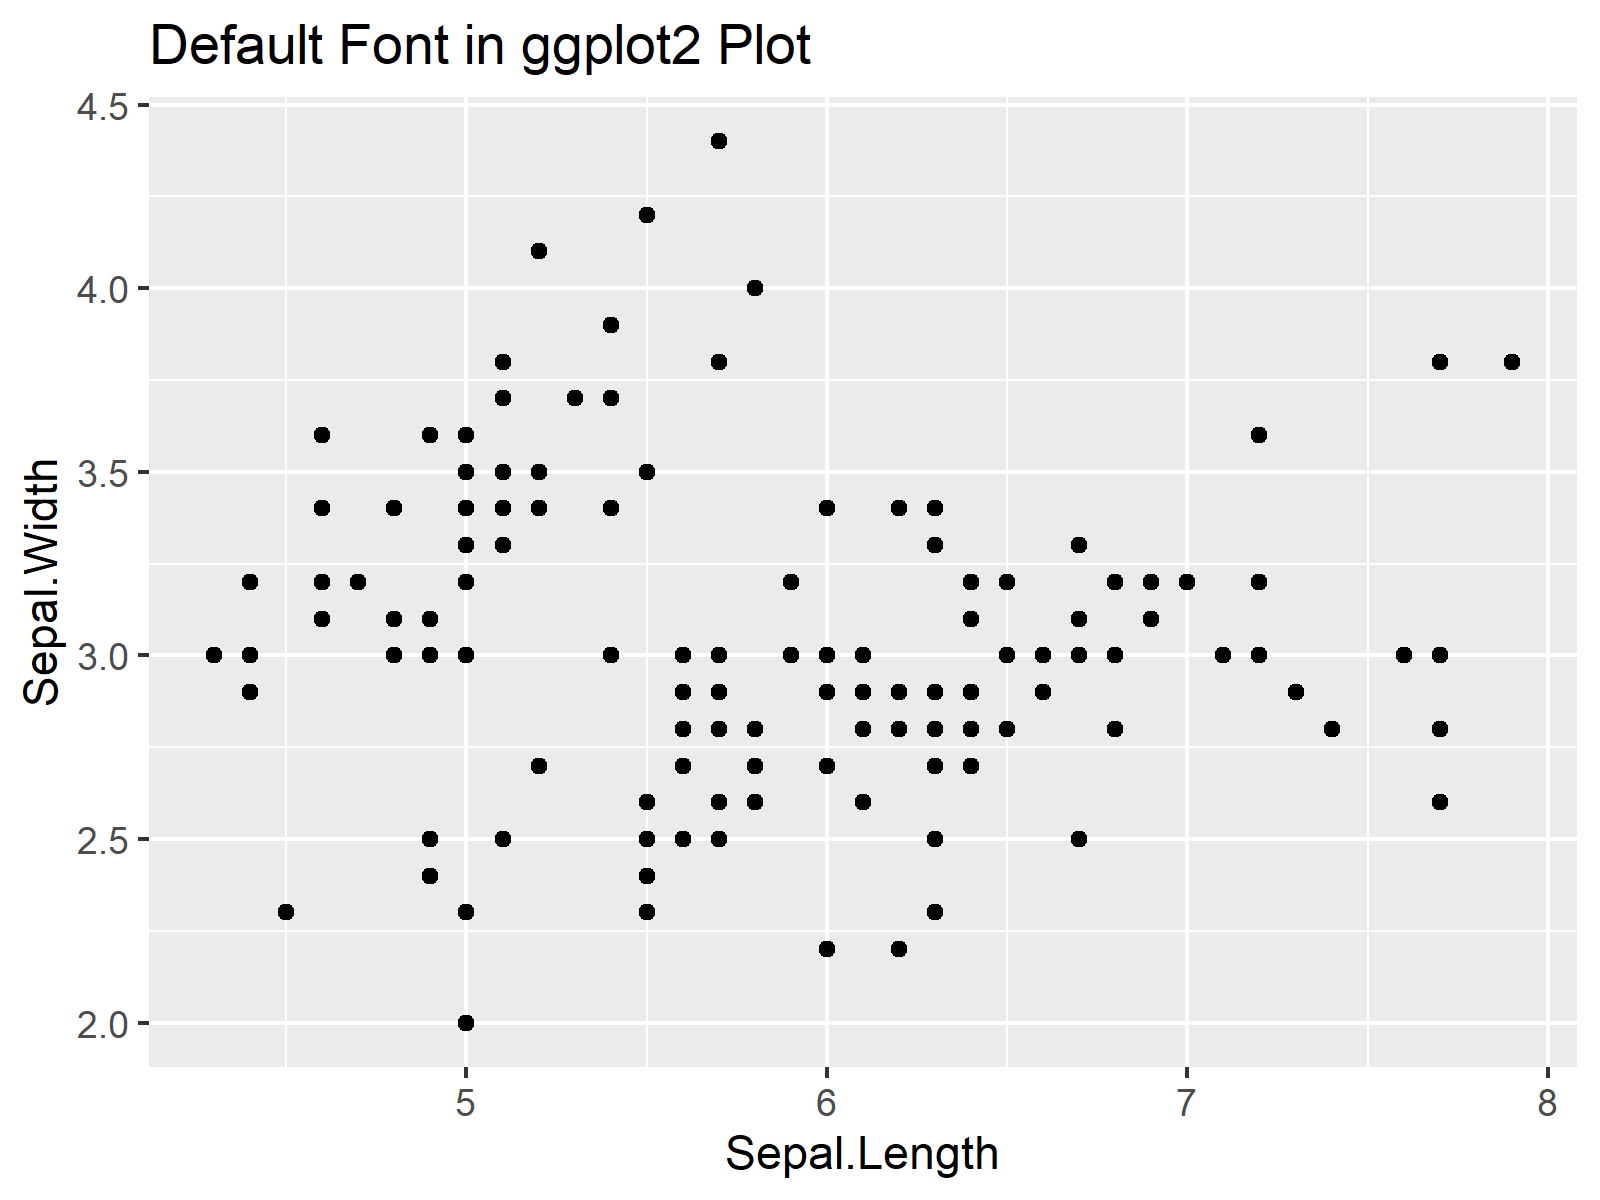
ggp <- ggplot(iris, # Creating plot with default font aes(Sepal.Length, Sepal.Width)) + geom_point() + ggtitle("Default Font in ggplot2 Plot") ggp # Drawing ggplot2 graphic |
ggp <- ggplot(iris, # Creating plot with default font aes(Sepal.Length, Sepal.Width)) + geom_point() + ggtitle("Default Font in ggplot2 Plot") ggp # Drawing ggplot2 graphic

windowsFonts(my_font = windowsFont("Times New Roman")) # Specify font |
windowsFonts(my_font = windowsFont("Times New Roman")) # Specify font
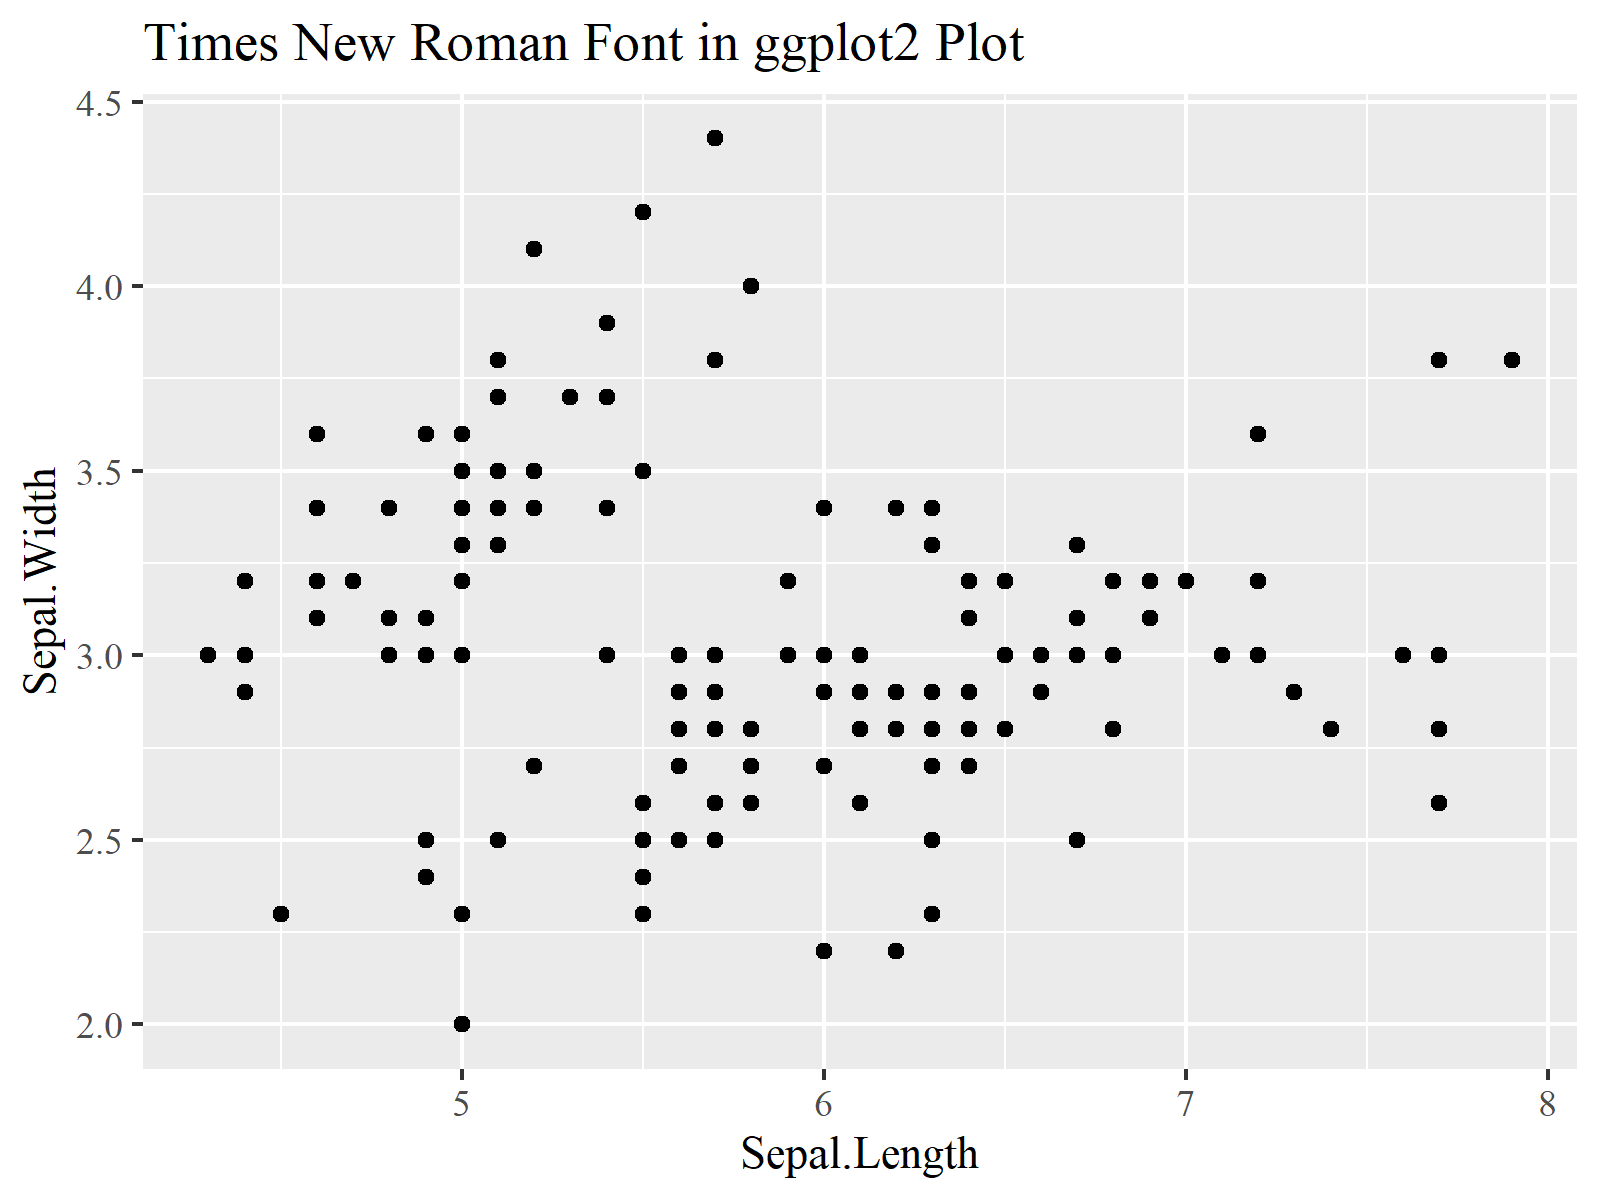
ggp + # Drawing ggplot2 plot with user-defined font ggtitle("Times New Roman Font in ggplot2 Plot") + theme(text = element_text(family = "my_font")) |
ggp + # Drawing ggplot2 plot with user-defined font ggtitle("Times New Roman Font in ggplot2 Plot") + theme(text = element_text(family = "my_font"))

Example 3: Export Graphic as PDF with Different Font Family
pdf("ggp.pdf", family = "Times") # Exporting plot as PDF document ggp dev.off() |
pdf("ggp.pdf", family = "Times") # Exporting plot as PDF document ggp dev.off()
Related Tutorials & Further Resources
Please find some additional R programming tutorials in the following list:
