ggplot2 Error in R – StatBin requires continuous x variable (2 Examples)
In this article, I’ll demonstrate how to handle the “Error: StatBin requires a continuous x variable: the x variable is discrete.Perhaps you want stat=”count”?” in the R programming language.
Setting up the Examples
data(iris) # Load example data head(iris) # Sepal.Length Sepal.Width Petal.Length Petal.Width Species # 1 5.1 3.5 1.4 0.2 setosa # 2 4.9 3.0 1.4 0.2 setosa # 3 4.7 3.2 1.3 0.2 setosa # 4 4.6 3.1 1.5 0.2 setosa # 5 5.0 3.6 1.4 0.2 setosa # 6 5.4 3.9 1.7 0.4 setosa |
data(iris) # Load example data head(iris) # Sepal.Length Sepal.Width Petal.Length Petal.Width Species # 1 5.1 3.5 1.4 0.2 setosa # 2 4.9 3.0 1.4 0.2 setosa # 3 4.7 3.2 1.3 0.2 setosa # 4 4.6 3.1 1.5 0.2 setosa # 5 5.0 3.6 1.4 0.2 setosa # 6 5.4 3.9 1.7 0.4 setosa
install.packages("ggplot2") # Install ggplot2 package library("ggplot2") # Load ggplot2 package |
install.packages("ggplot2") # Install ggplot2 package library("ggplot2") # Load ggplot2 package
Example 1: How to Replicate the Error: StatBin requires a continuous x variable
ggplot(iris, aes(x = Species)) + # Cannot draw histogram of categorical variable geom_histogram() # Error: StatBin requires a continuous x variable: the x variable is discrete.Perhaps you want stat="count"? |
ggplot(iris, aes(x = Species)) + # Cannot draw histogram of categorical variable geom_histogram() # Error: StatBin requires a continuous x variable: the x variable is discrete.Perhaps you want stat="count"?
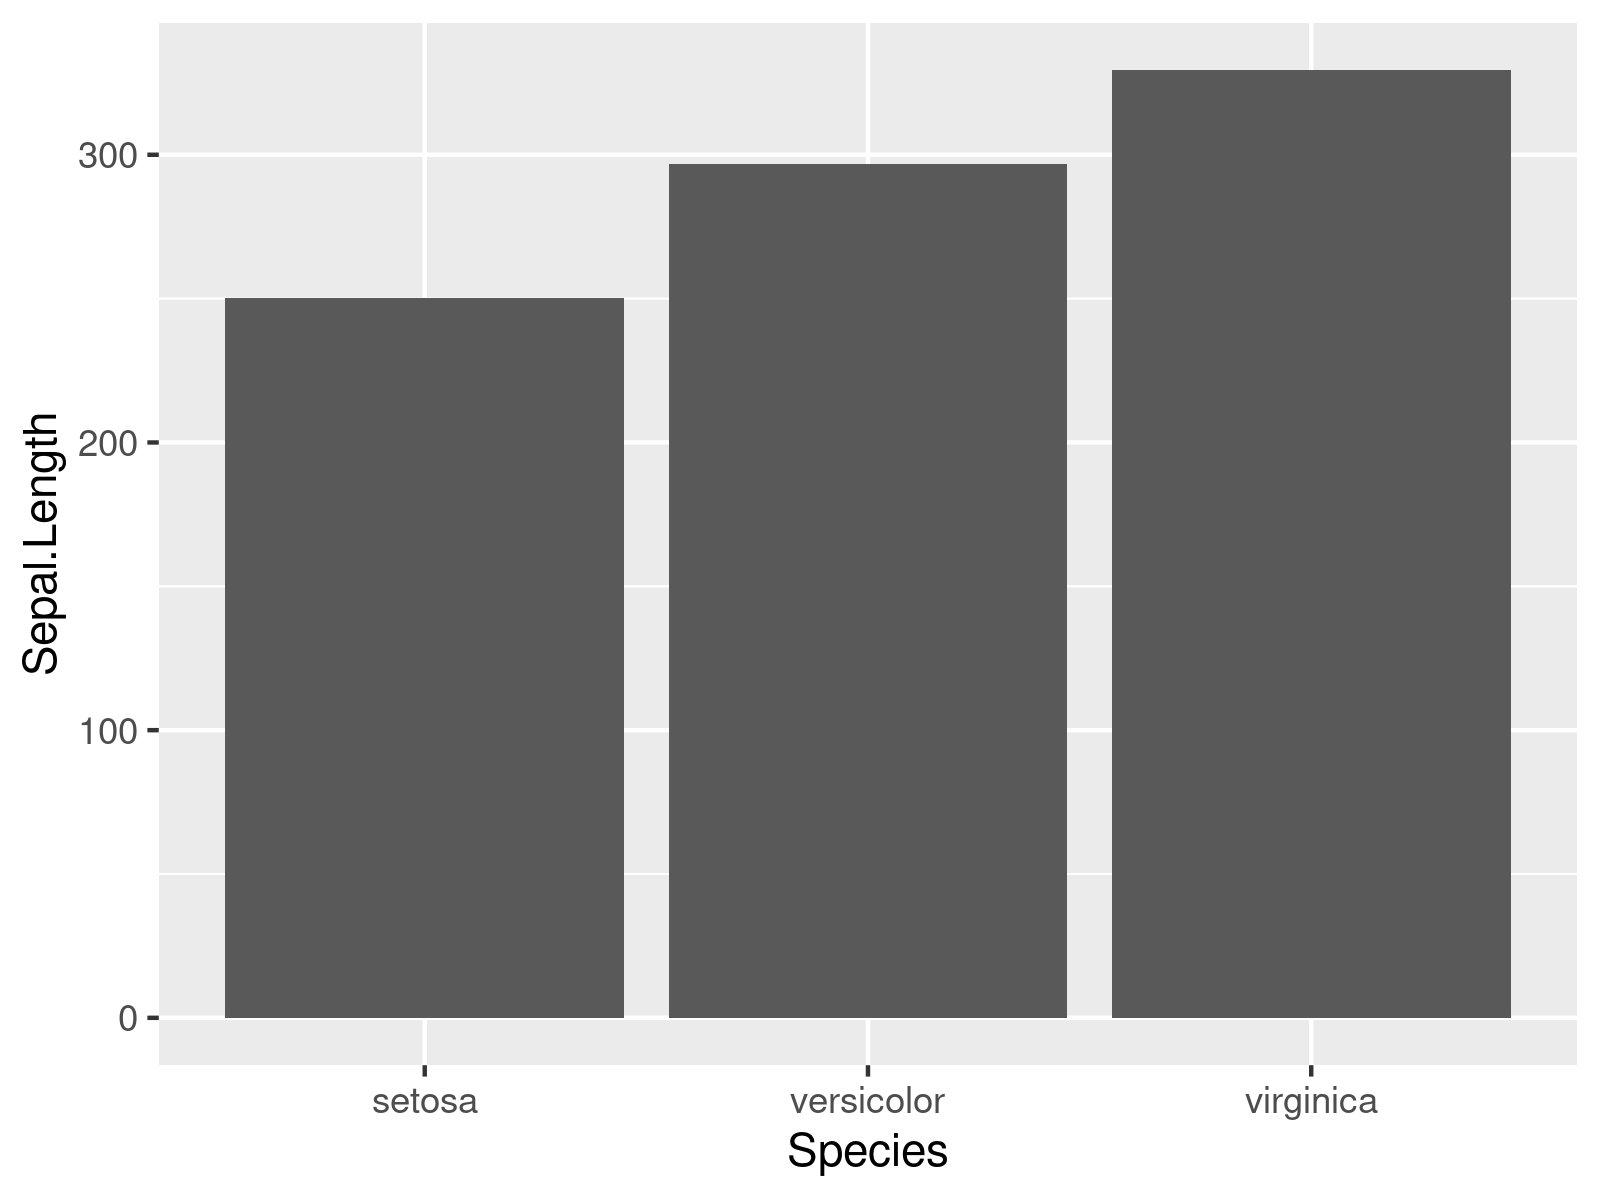
Example 2: How to Solve the Error: StatBin requires a continuous x variable
ggplot(iris, aes(x = Species, y = Sepal.Length)) + # Drawing Barchart works fine geom_bar(stat = "identity") |
ggplot(iris, aes(x = Species, y = Sepal.Length)) + # Drawing Barchart works fine geom_bar(stat = "identity")

