ggplot2 Error in R: Discrete Value Supplied to Continuous Scale (2 Examples)
In this article, I’ll illustrate how to handle the ggplot2 error “Discrete value supplied to continuous scale” in R programming.
Preparing the Examples
data(iris) # Iris flower data as example data.frame head(iris) # Sepal.Length Sepal.Width Petal.Length Petal.Width Species # 1 5.1 3.5 1.4 0.2 setosa # 2 4.9 3.0 1.4 0.2 setosa # 3 4.7 3.2 1.3 0.2 setosa # 4 4.6 3.1 1.5 0.2 setosa # 5 5.0 3.6 1.4 0.2 setosa # 6 5.4 3.9 1.7 0.4 setosa |
data(iris) # Iris flower data as example data.frame head(iris) # Sepal.Length Sepal.Width Petal.Length Petal.Width Species # 1 5.1 3.5 1.4 0.2 setosa # 2 4.9 3.0 1.4 0.2 setosa # 3 4.7 3.2 1.3 0.2 setosa # 4 4.6 3.1 1.5 0.2 setosa # 5 5.0 3.6 1.4 0.2 setosa # 6 5.4 3.9 1.7 0.4 setosa
install.packages("ggplot2") # Install ggplot2 package library("ggplot2") # Load ggplot2 |
install.packages("ggplot2") # Install ggplot2 package library("ggplot2") # Load ggplot2
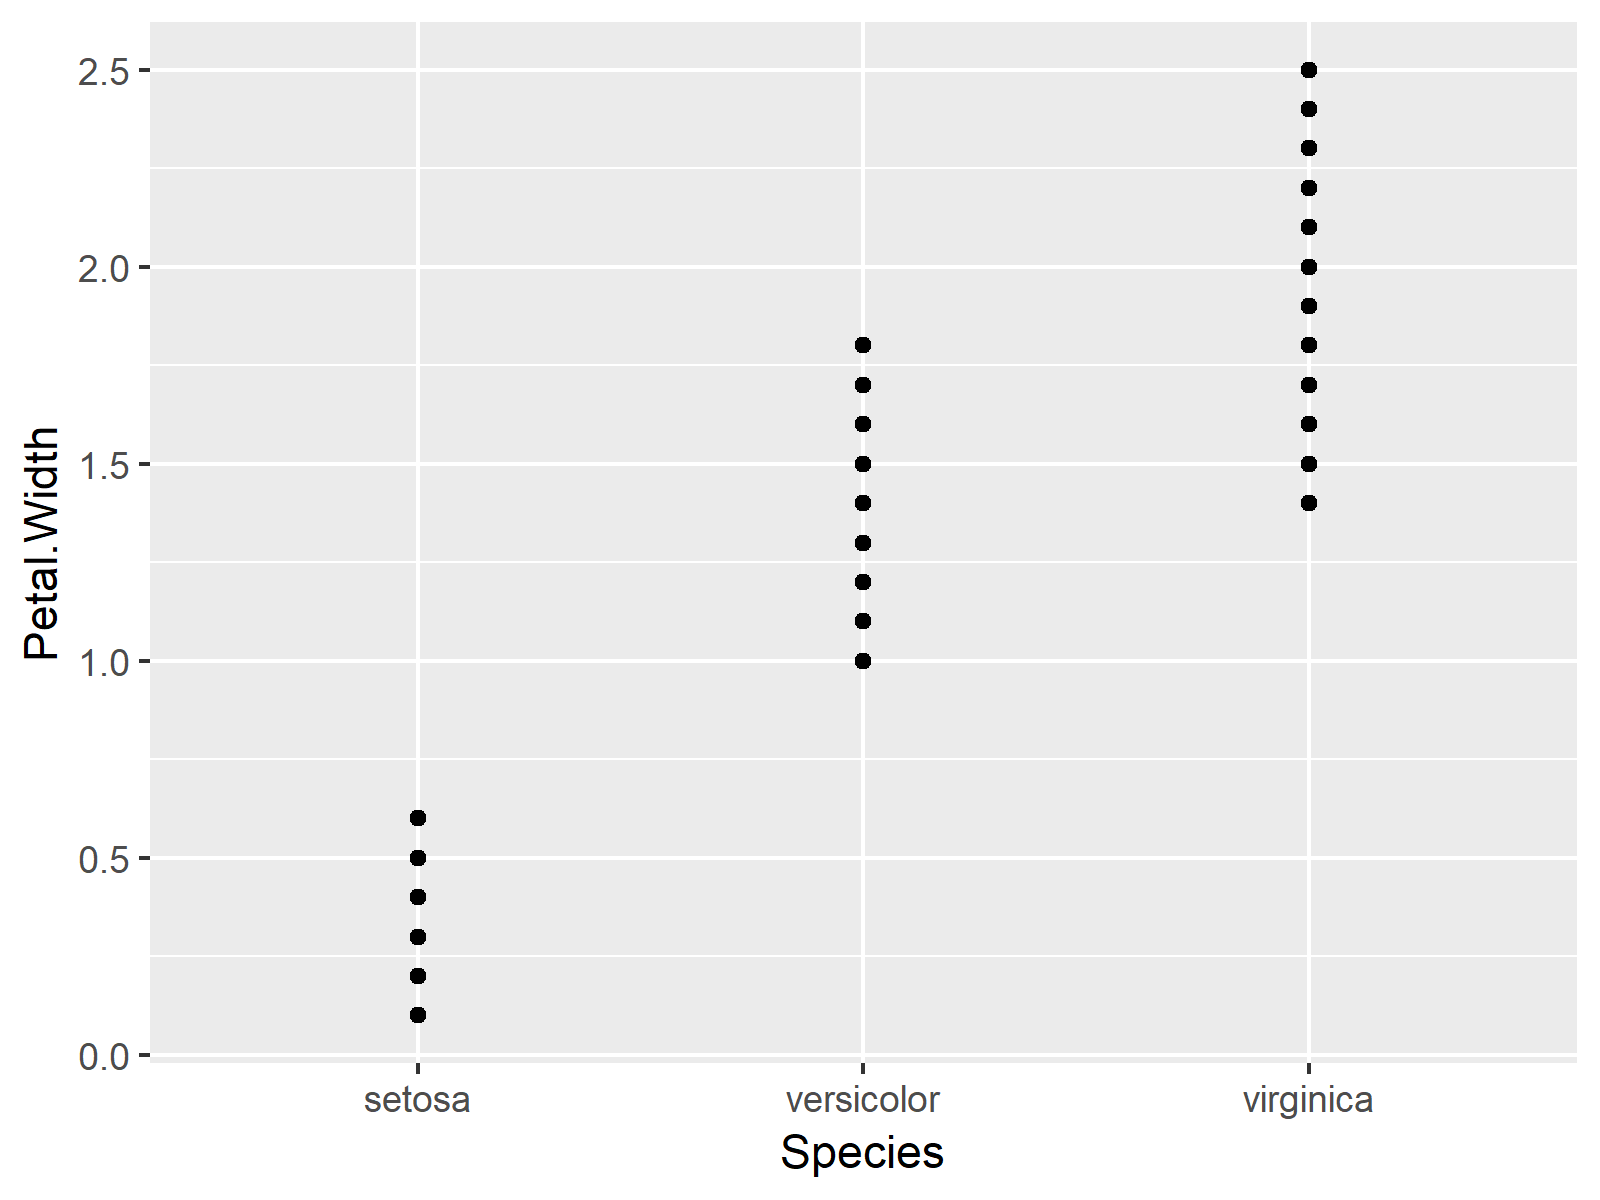
With the default specifications, it works fine:
ggplot(iris, # ggplot2 plot of iris data aes(x = Species, y = Petal.Width)) + geom_point() |
ggplot(iris, # ggplot2 plot of iris data aes(x = Species, y = Petal.Width)) + geom_point()

Example 1: Replicating the Error Message: Discrete value supplied to continuous scale
ggplot(iris, # False usage of scale_x_continuous aes(x = Species, y = Petal.Width)) + geom_point() + scale_x_continuous(limits = c(0, 100)) # Error: Discrete value supplied to continuous scale |
ggplot(iris, # False usage of scale_x_continuous aes(x = Species, y = Petal.Width)) + geom_point() + scale_x_continuous(limits = c(0, 100)) # Error: Discrete value supplied to continuous scale
Example 2: Solving the Error Message: Discrete value supplied to continuous scale
Create a subset of the data frame:
iris_subset <- iris[iris$Species != "setosa", ] # Remove category from data |
iris_subset <- iris[iris$Species != "setosa", ] # Remove category from data
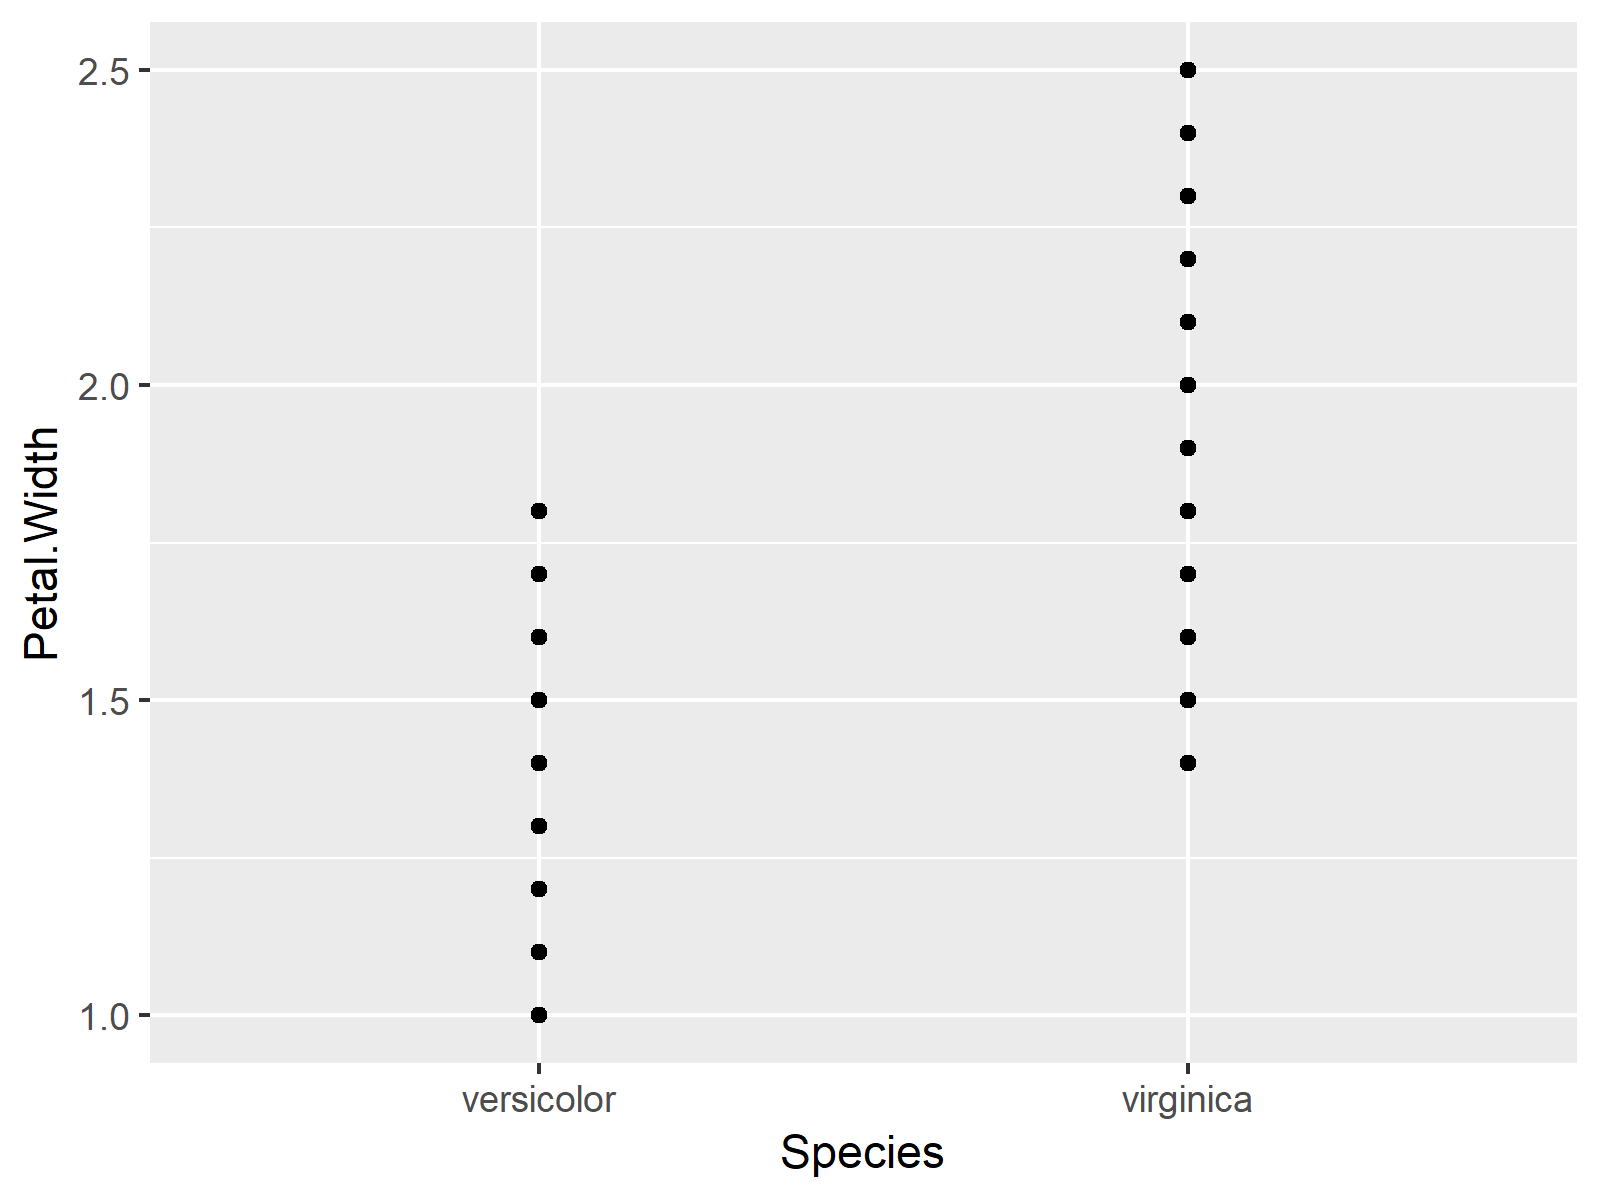
Draw ggplot2 plot of subset:
ggplot(iris_subset, # ggplot2 plot with less categories aes(x = Species, y = Petal.Width)) + geom_point() |
ggplot(iris_subset, # ggplot2 plot with less categories aes(x = Species, y = Petal.Width)) + geom_point()

