Fitting a Smooth Line to Data in R Programming
In this tutorial, I’ll show how to draw a smooth line to a scatterplot in the R programming language.
Creation of Example Data
data(iris) # Load iris data set x <- 1:nrow(iris) # Store relevant values y <- iris$Sepal.Length |
data(iris) # Load iris data set x <- 1:nrow(iris) # Store relevant values y <- iris$Sepal.Length
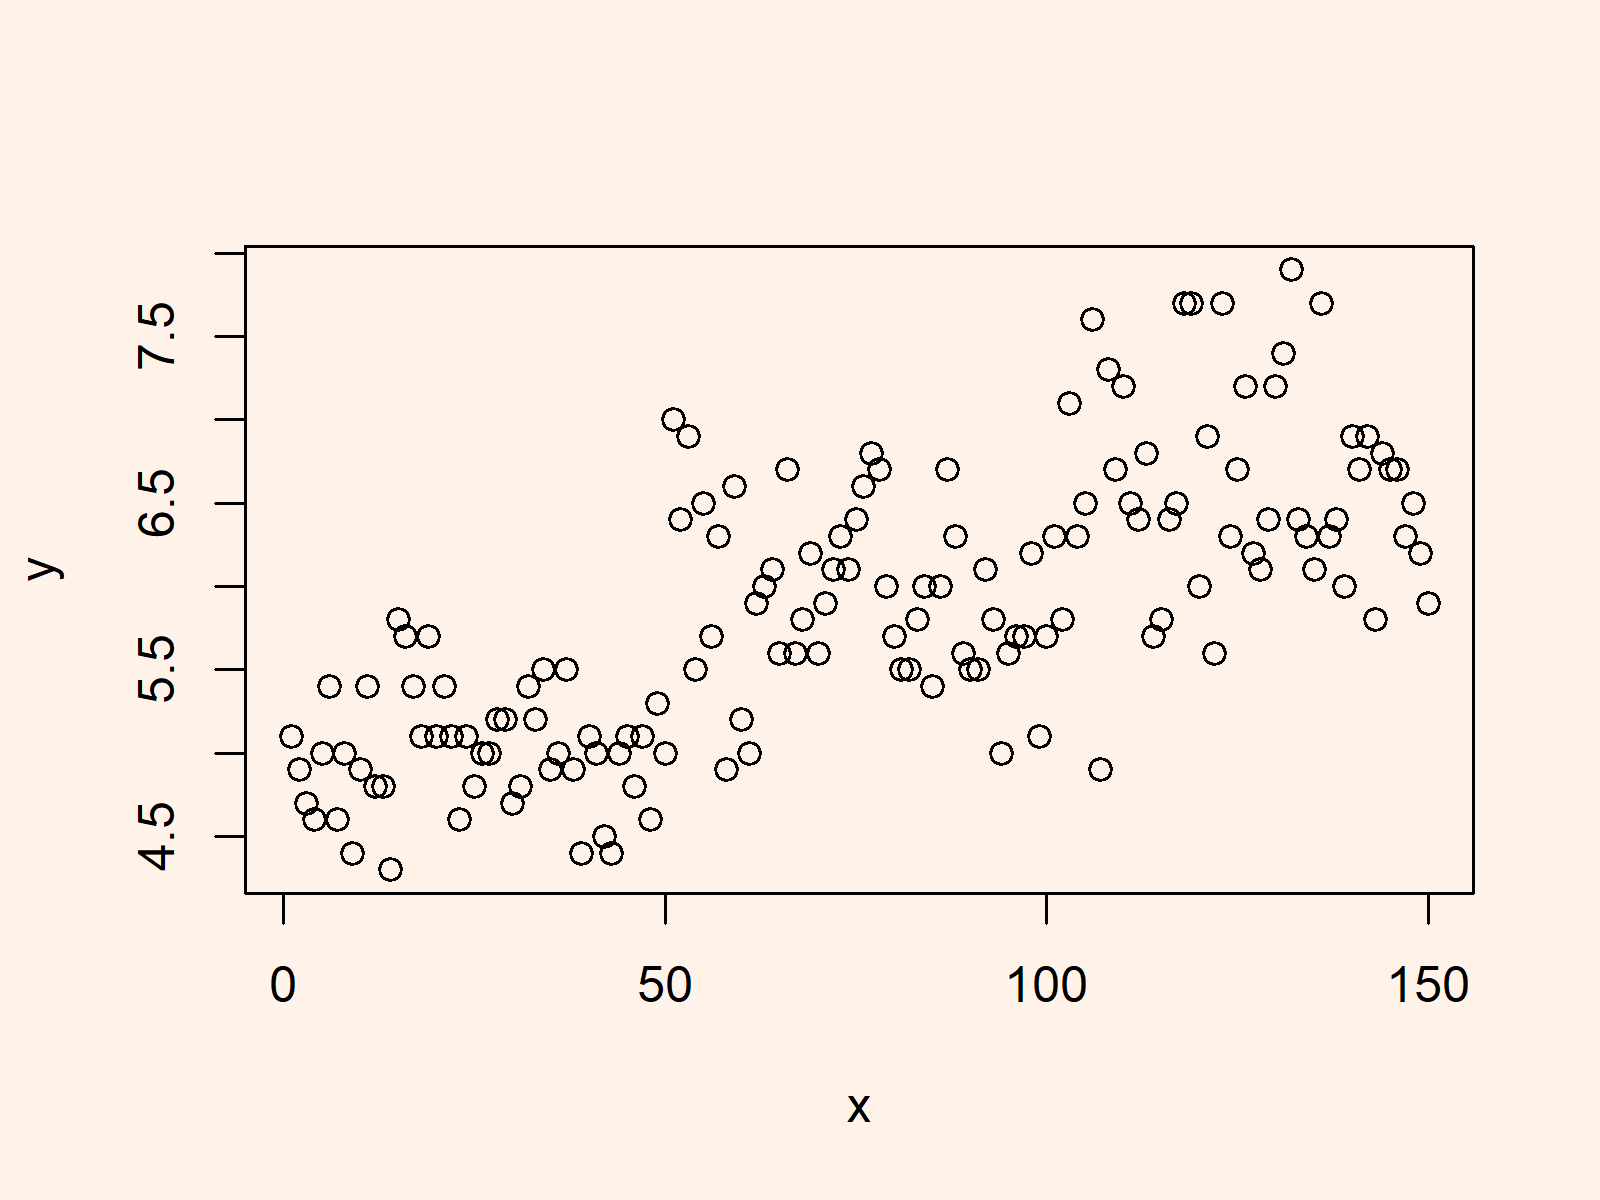
plot(x, y) # Plot iris without line |
plot(x, y) # Plot iris without line

Example: Fit Smooth Line ti Iris Data
curve_values <- loess(y ~ x) # Application of loess function |
curve_values <- loess(y ~ x) # Application of loess function
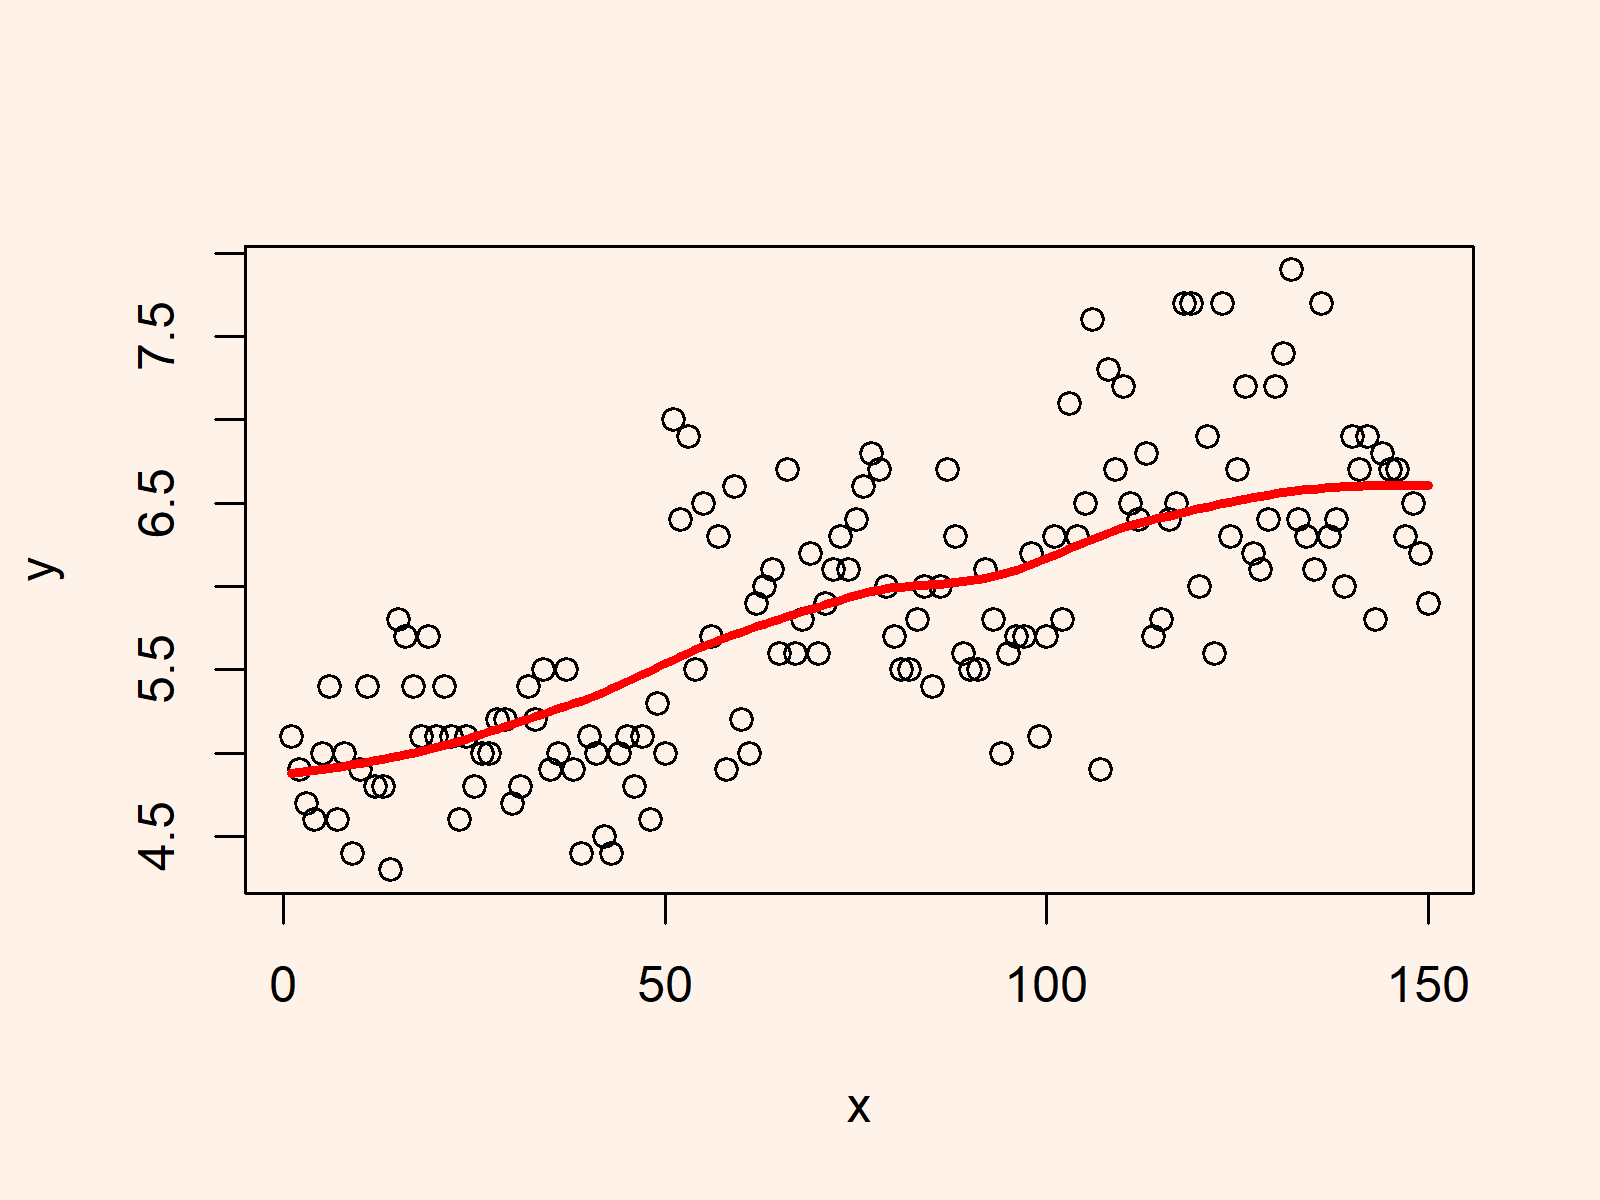
plot(x, y) # Iris data with fitted line lines(predict(curve_values), col = "red", lwd = 3) |
plot(x, y) # Iris data with fitted line lines(predict(curve_values), col = "red", lwd = 3)

