How to Draw Median & Mean Line to Histogram in R (2 Examples)
In this tutorial you’ll learn how to add a vertical mean or median line to a graph in R programming.
Preparing the Examples
data(iris) # Loading example data for plot head(iris) # Sepal.Length Sepal.Width Petal.Length Petal.Width Species # 1 5.1 3.5 1.4 0.2 setosa # 2 4.9 3.0 1.4 0.2 setosa # 3 4.7 3.2 1.3 0.2 setosa # 4 4.6 3.1 1.5 0.2 setosa # 5 5.0 3.6 1.4 0.2 setosa # 6 5.4 3.9 1.7 0.4 setosa |
data(iris) # Loading example data for plot head(iris) # Sepal.Length Sepal.Width Petal.Length Petal.Width Species # 1 5.1 3.5 1.4 0.2 setosa # 2 4.9 3.0 1.4 0.2 setosa # 3 4.7 3.2 1.3 0.2 setosa # 4 4.6 3.1 1.5 0.2 setosa # 5 5.0 3.6 1.4 0.2 setosa # 6 5.4 3.9 1.7 0.4 setosa
Example 1: Adding Median & Mean to Histogram Using Base R
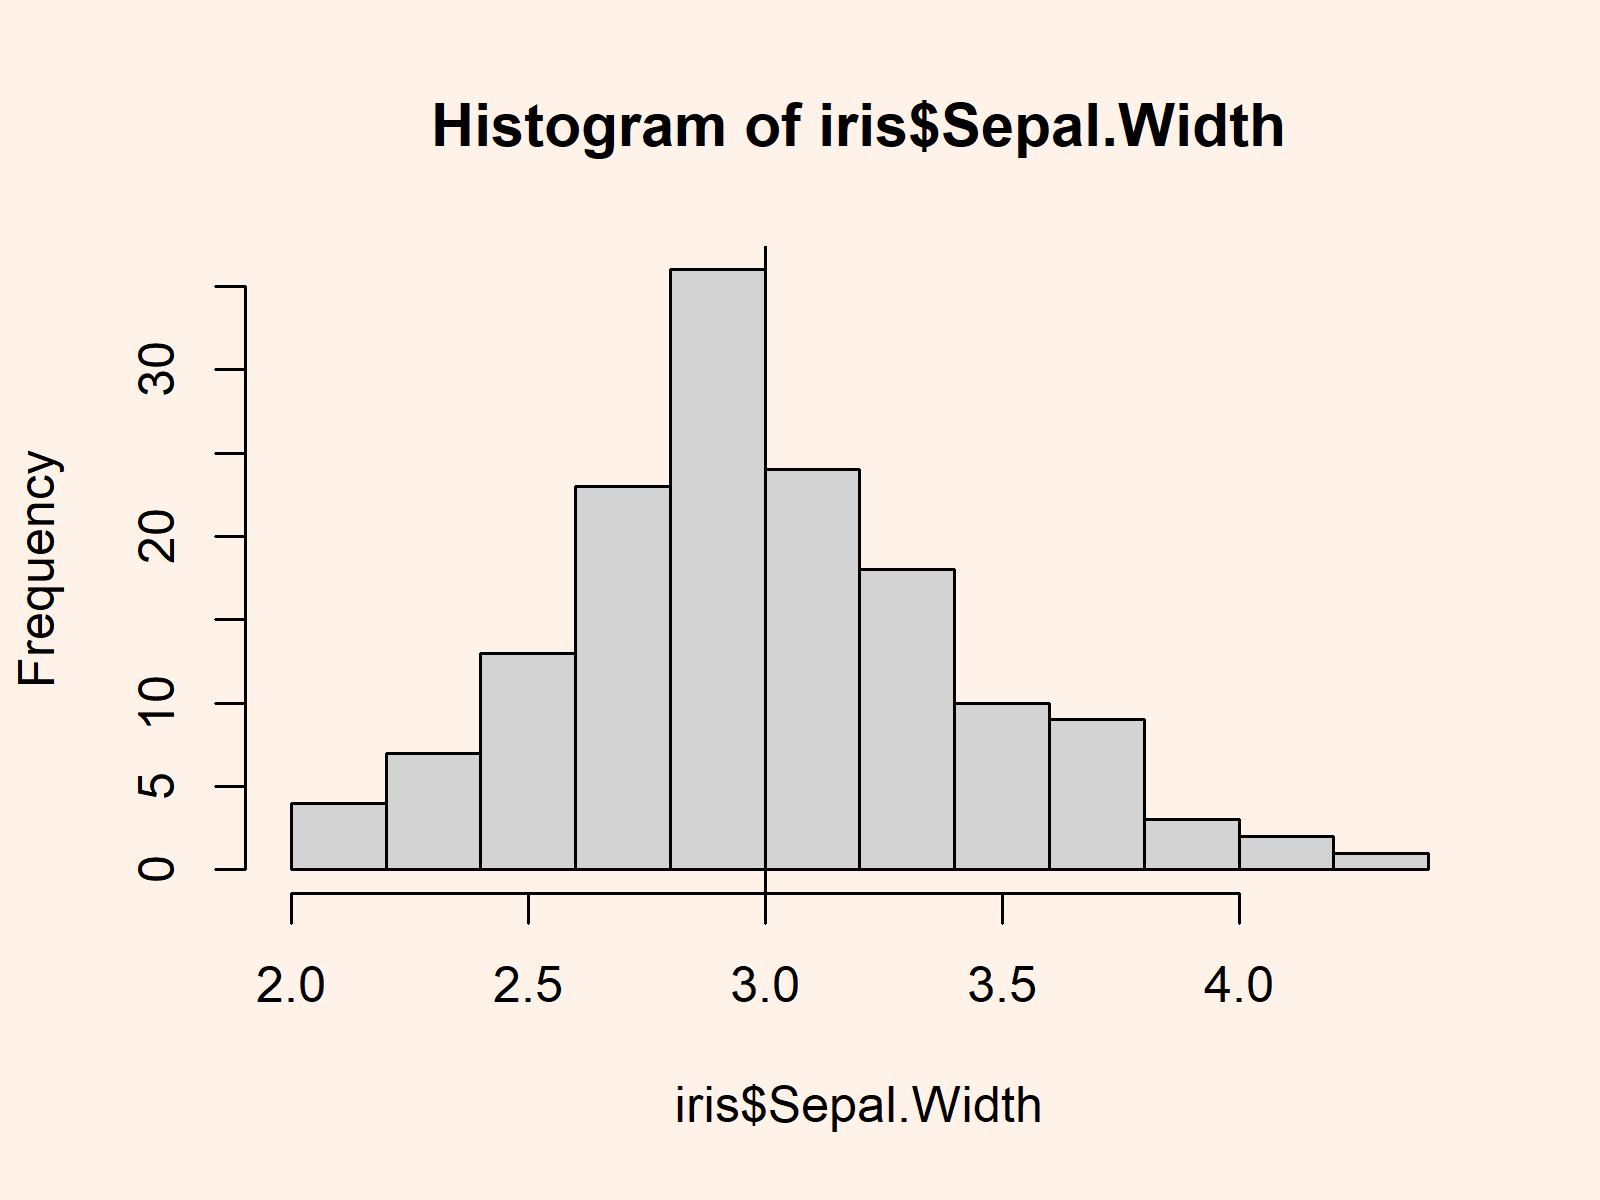
hist(iris$Sepal.Width) # Histogram with median line abline(v = median(iris$Sepal.Width)) |
hist(iris$Sepal.Width) # Histogram with median line abline(v = median(iris$Sepal.Width))

hist(iris$Sepal.Width) # Histogram with mean line abline(v = mean(iris$Sepal.Width)) |
hist(iris$Sepal.Width) # Histogram with mean line abline(v = mean(iris$Sepal.Width))

Example 2: Adding Median & Mean to Histogram Using ggplot2 Package
install.packages("ggplot2") # Install ggplot2 package library("ggplot2") # Load ggplot2 |
install.packages("ggplot2") # Install ggplot2 package library("ggplot2") # Load ggplot2
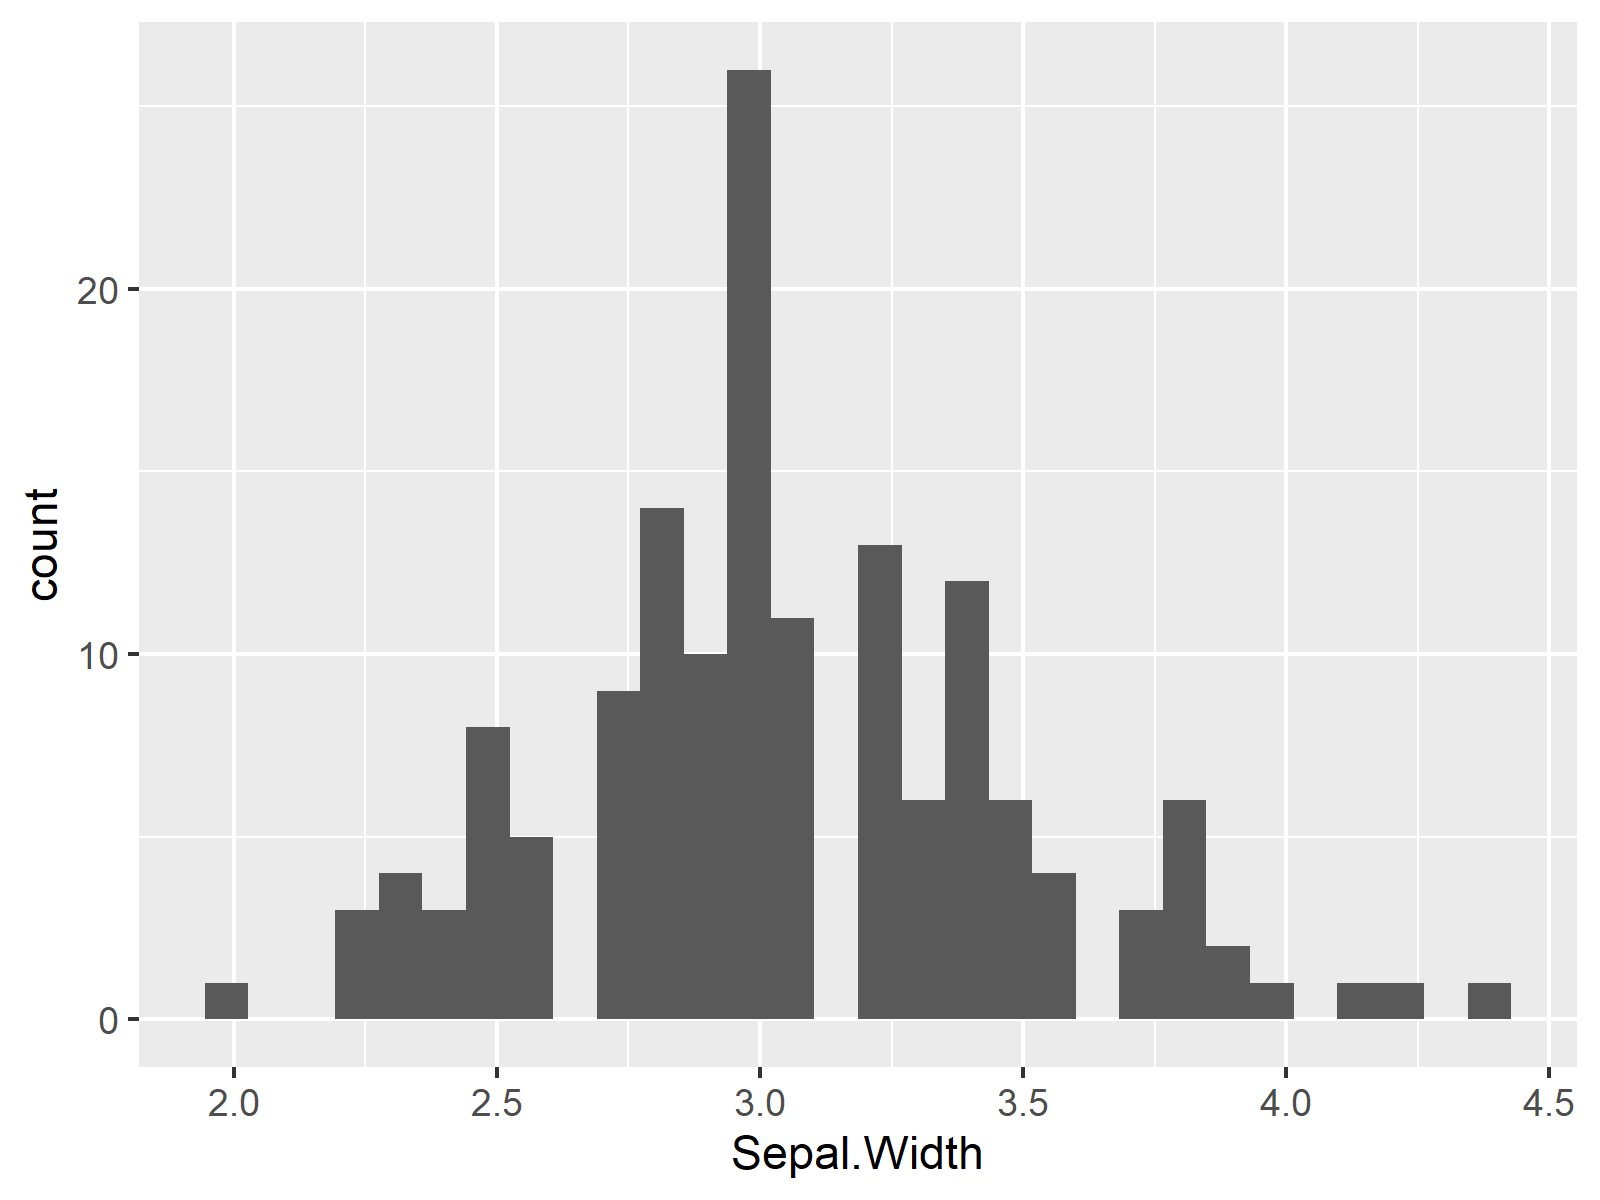
my_plot <- ggplot(iris, # Histogram without line aes(Sepal.Width)) + geom_histogram() my_plot |
my_plot <- ggplot(iris, # Histogram without line aes(Sepal.Width)) + geom_histogram() my_plot

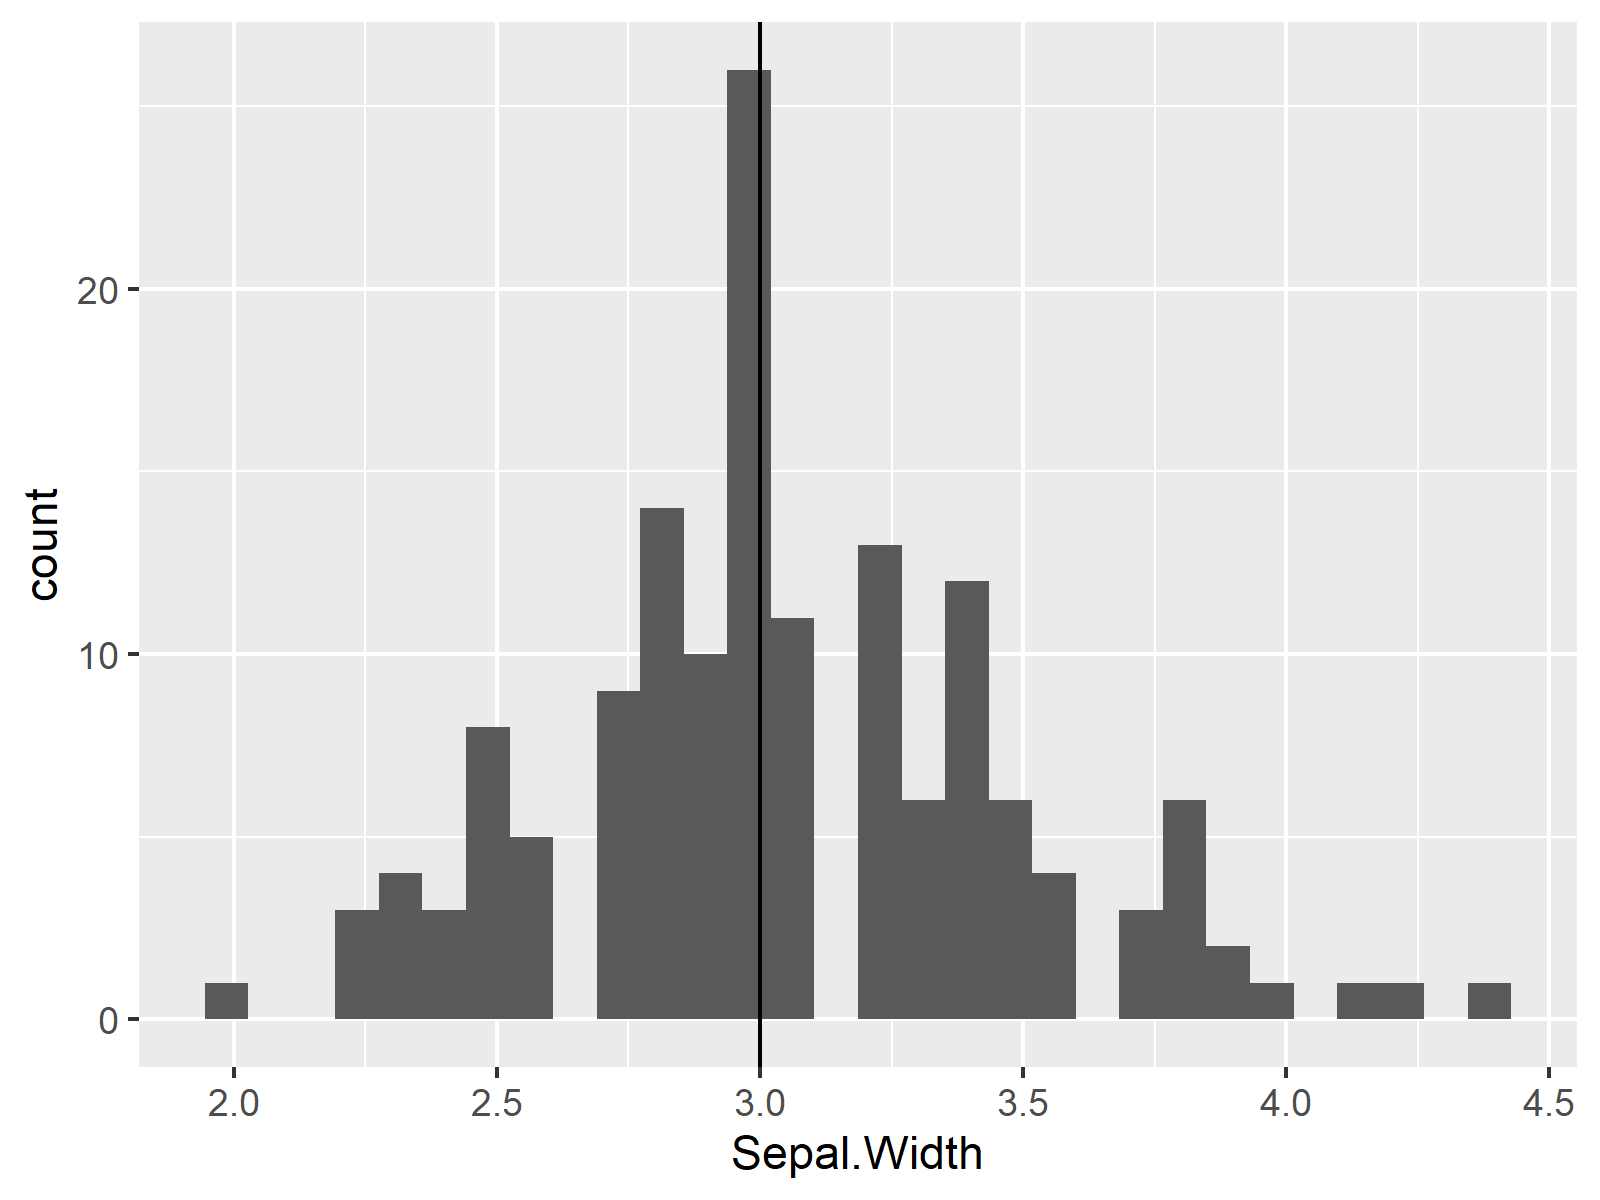
my_plot + # Histogram with median line geom_vline(xintercept = median(iris$Sepal.Width)) |
my_plot + # Histogram with median line geom_vline(xintercept = median(iris$Sepal.Width))

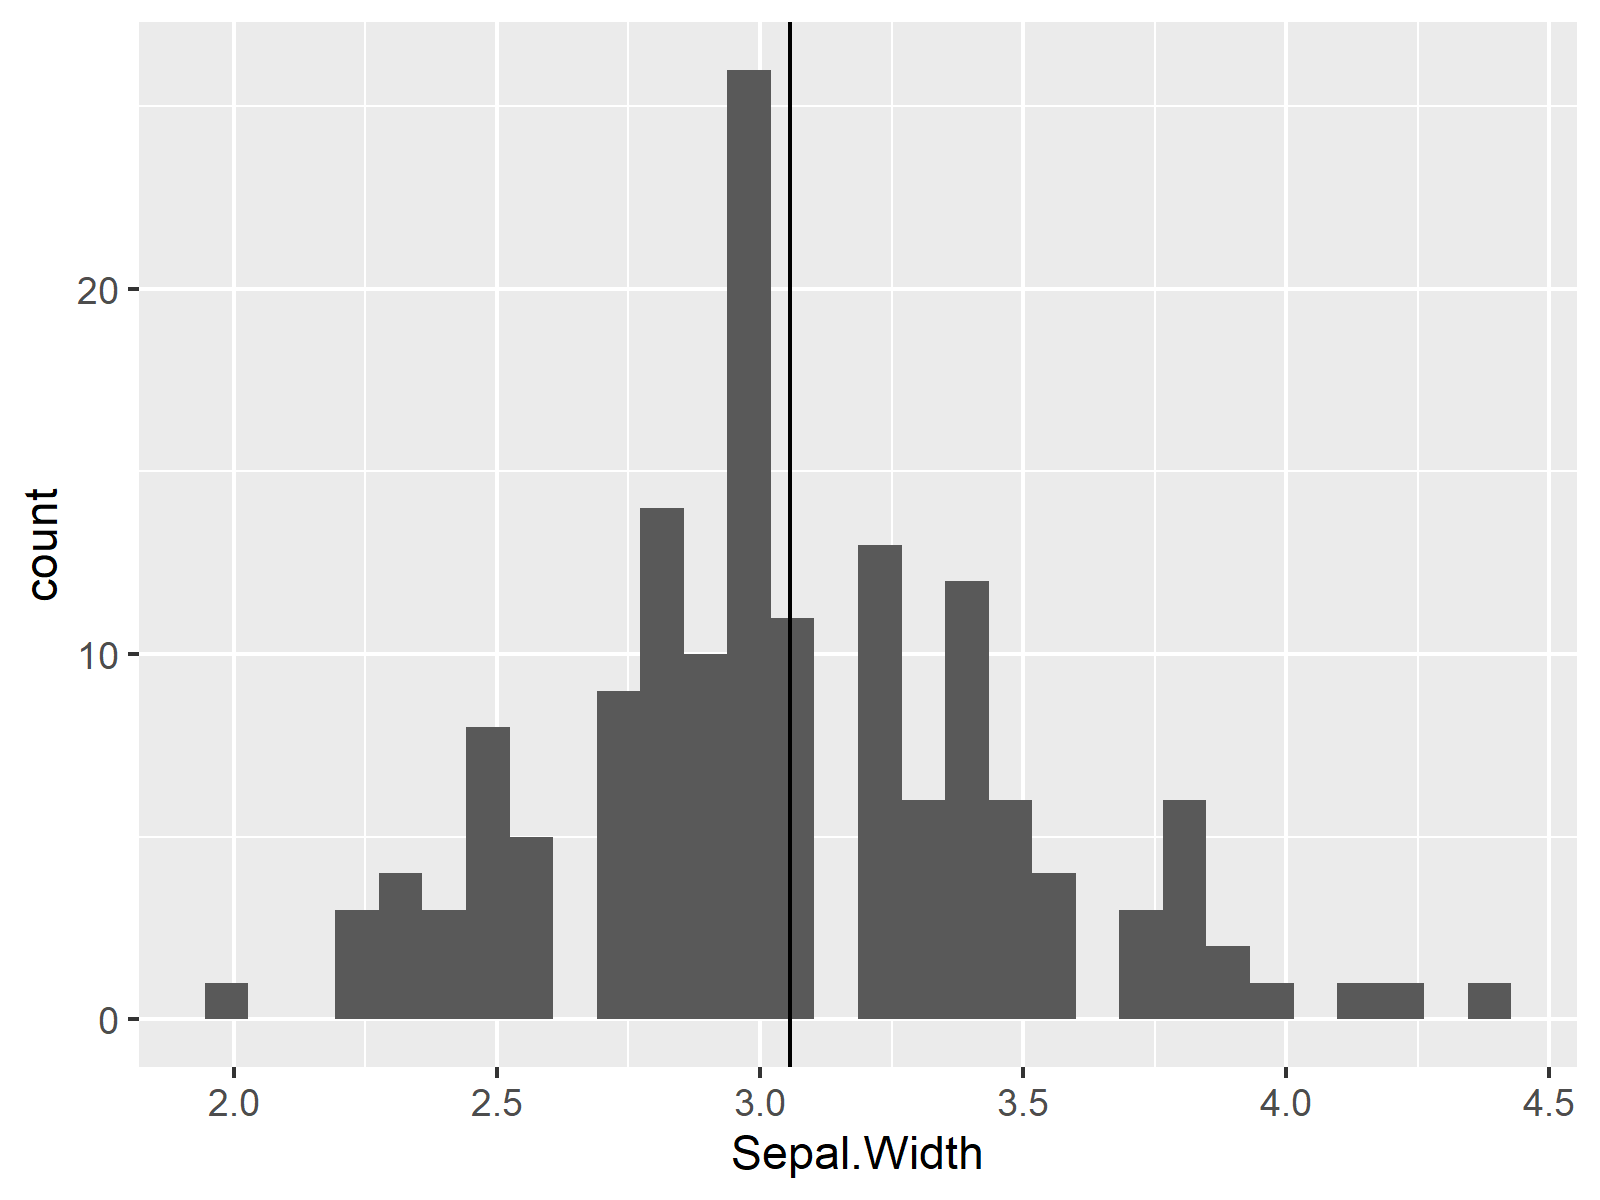
my_plot + # Histogram with mean line geom_vline(xintercept = mean(iris$Sepal.Width)) |
my_plot + # Histogram with mean line geom_vline(xintercept = mean(iris$Sepal.Width))

