Error in Plot: Need Finite xlim Values in R (2 Examples)
In this R tutorial you’ll learn how to deal with the plotting error message “need finite ‘xlim’ values”.
Creation of Example Data
x1 <- rep(NA, 5) # First x vector x2 <- 9:5 # Second x vector y <- 1:5 # y vector |
x1 <- rep(NA, 5) # First x vector x2 <- 9:5 # Second x vector y <- 1:5 # y vector
Example 1: Replicating the Error – need finite ‘xlim’ values
plot(x1, y) # Error message is returned due to NA vector # Error in plot.window(...) : need finite 'xlim' values # In addition: Warning messages: # 1: In min(x) : no non-missing arguments to min; returning Inf # 2: In max(x) : no non-missing arguments to max; returning -Inf |
plot(x1, y) # Error message is returned due to NA vector # Error in plot.window(...) : need finite 'xlim' values # In addition: Warning messages: # 1: In min(x) : no non-missing arguments to min; returning Inf # 2: In max(x) : no non-missing arguments to max; returning -Inf
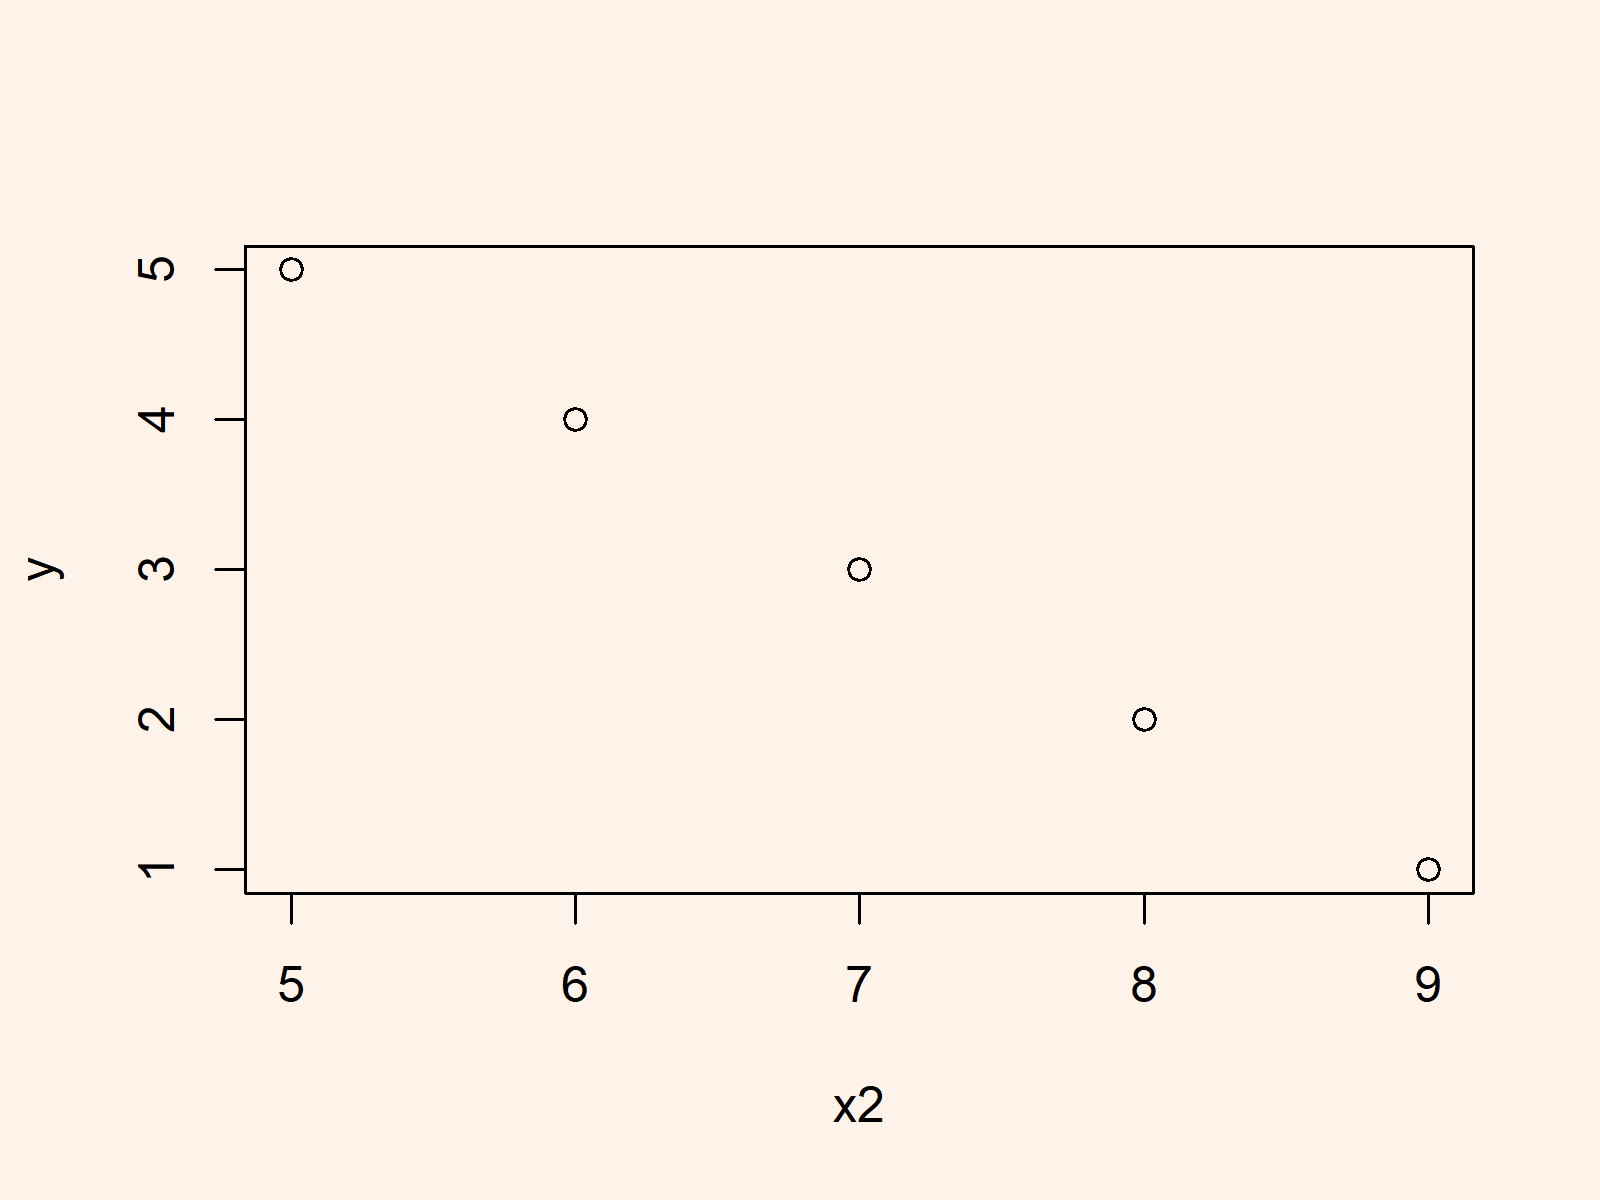
Example 2: Solving the Error – need finite ‘xlim’ values
plot(x2, y) # x vector without NA values works fine |
plot(x2, y) # x vector without NA values works fine

