How to Delete Outlier Values from Vector in R (Example Code)
In this article, I’ll show how to delete outlier values from a data vector in R programming.
Creation of Exemplifying Data
set.seed(98476492) # Setting seed my_data <- round(rnorm(500), 2) # Drawing random values my_data[1:3] <- c(10, 15, 20) # Inserting outliers to data my_data # Returning data to console # 10.00 15.00 20.00 0.28 -1.52 -0.57 -1.34 -0.55 0.06 -1.03 -0.85 -0.48 1.45 0.39 ... |
set.seed(98476492) # Setting seed my_data <- round(rnorm(500), 2) # Drawing random values my_data[1:3] <- c(10, 15, 20) # Inserting outliers to data my_data # Returning data to console # 10.00 15.00 20.00 0.28 -1.52 -0.57 -1.34 -0.55 0.06 -1.03 -0.85 -0.48 1.45 0.39 ...
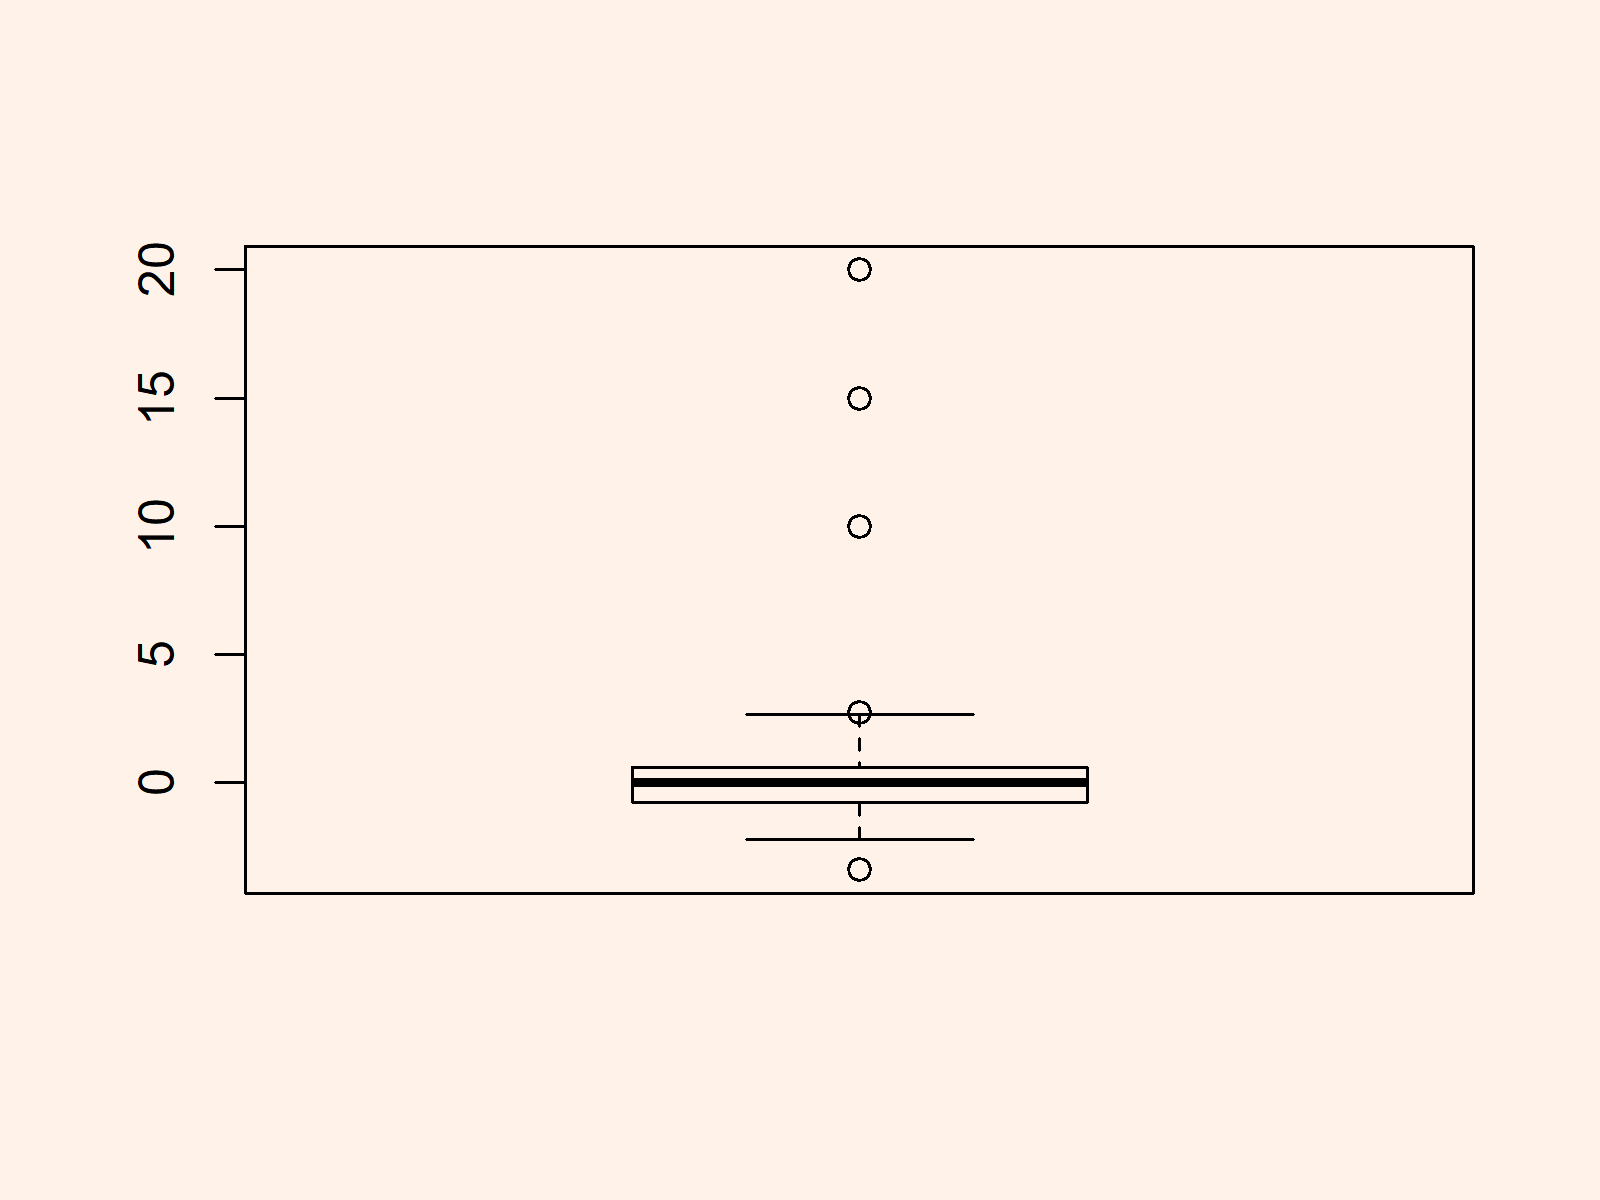
boxplot(my_data) # Drawing boxplot with outliers |
boxplot(my_data) # Drawing boxplot with outliers

Example: Apply boxplot.stats Function to Delete Outliers
my_data_out_rm <- my_data[! my_data %in% # Removing outlier values boxplot.stats(my_data)$out] |
my_data_out_rm <- my_data[! my_data %in% # Removing outlier values boxplot.stats(my_data)$out]
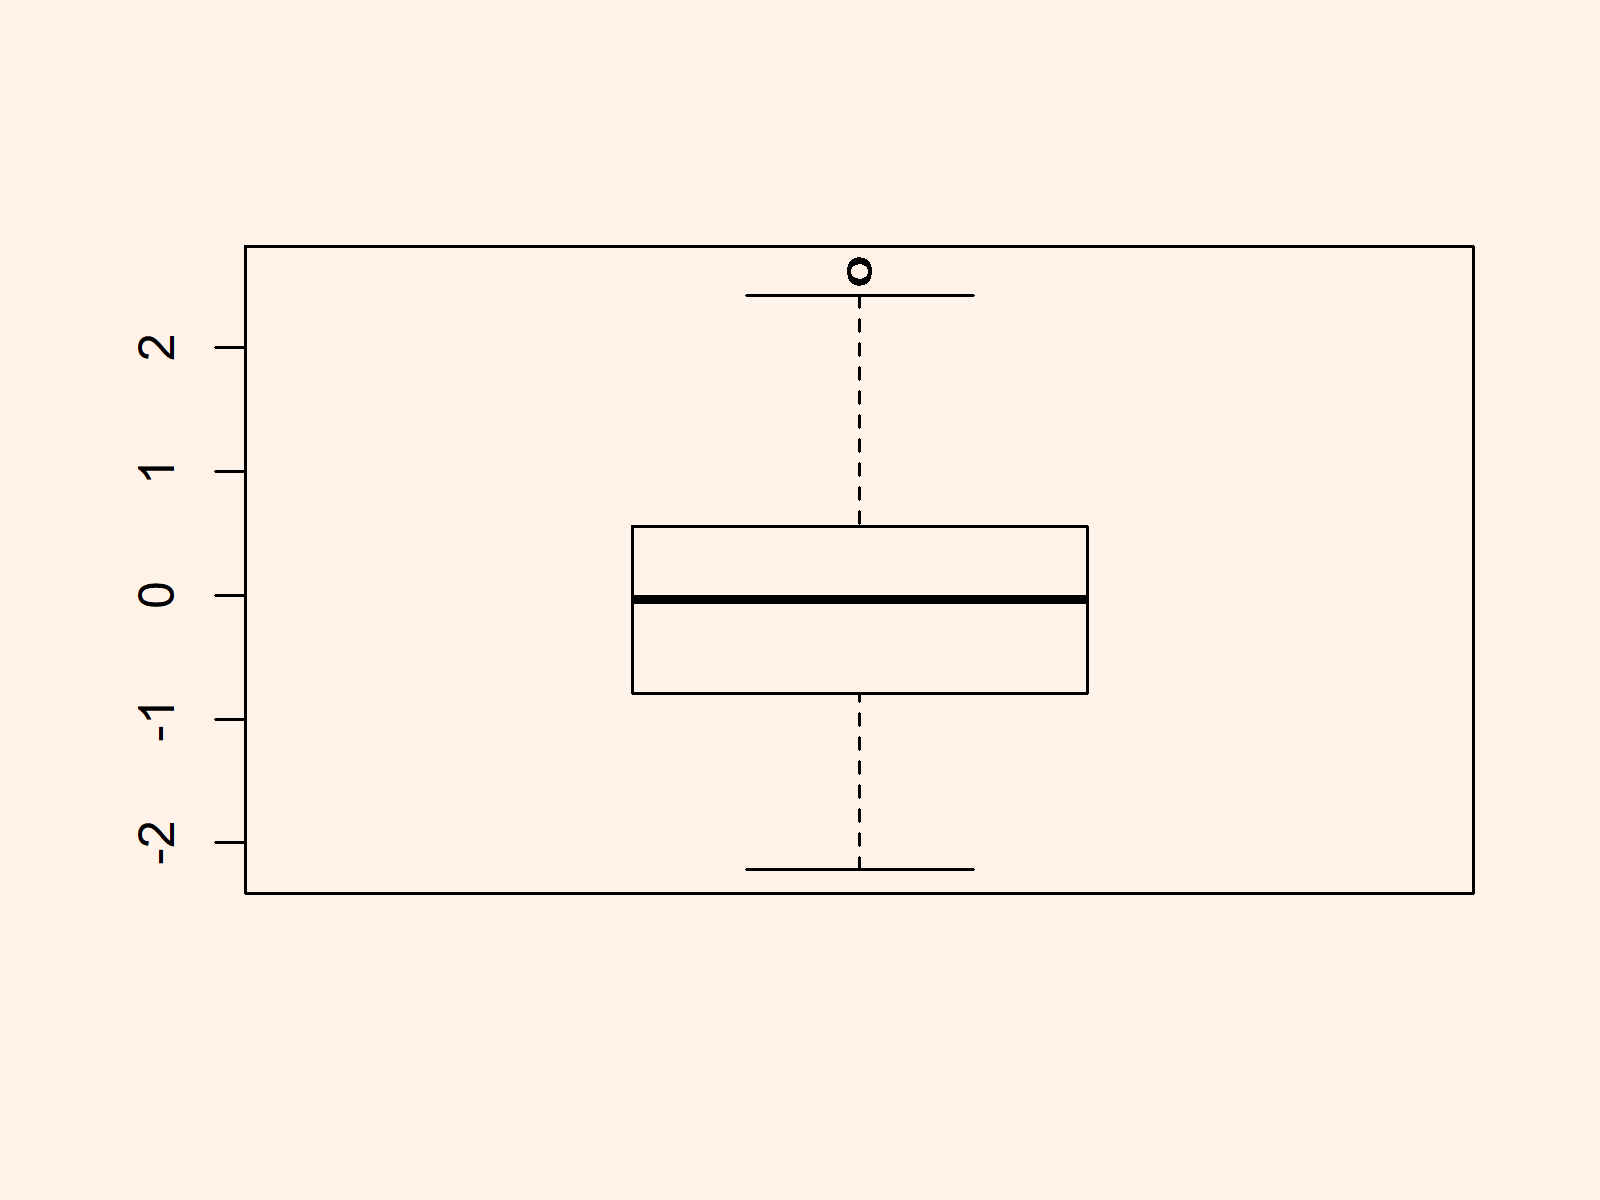
boxplot(my_data_out_rm) # Drawing boxplot without outliers |
boxplot(my_data_out_rm) # Drawing boxplot without outliers

Note that outlier detection has to be done with care. I therefore strongly recommend to get a good theoretical understanding of outliers before deleting them.
