Create ggplot2 Barchart with Rounded Bars in R (Example Code)
In this article you’ll learn how to visualize a ggplot2 barchart with rounded bars using the ggchicklet package in the R programming language.
Creation of Exemplifying Data
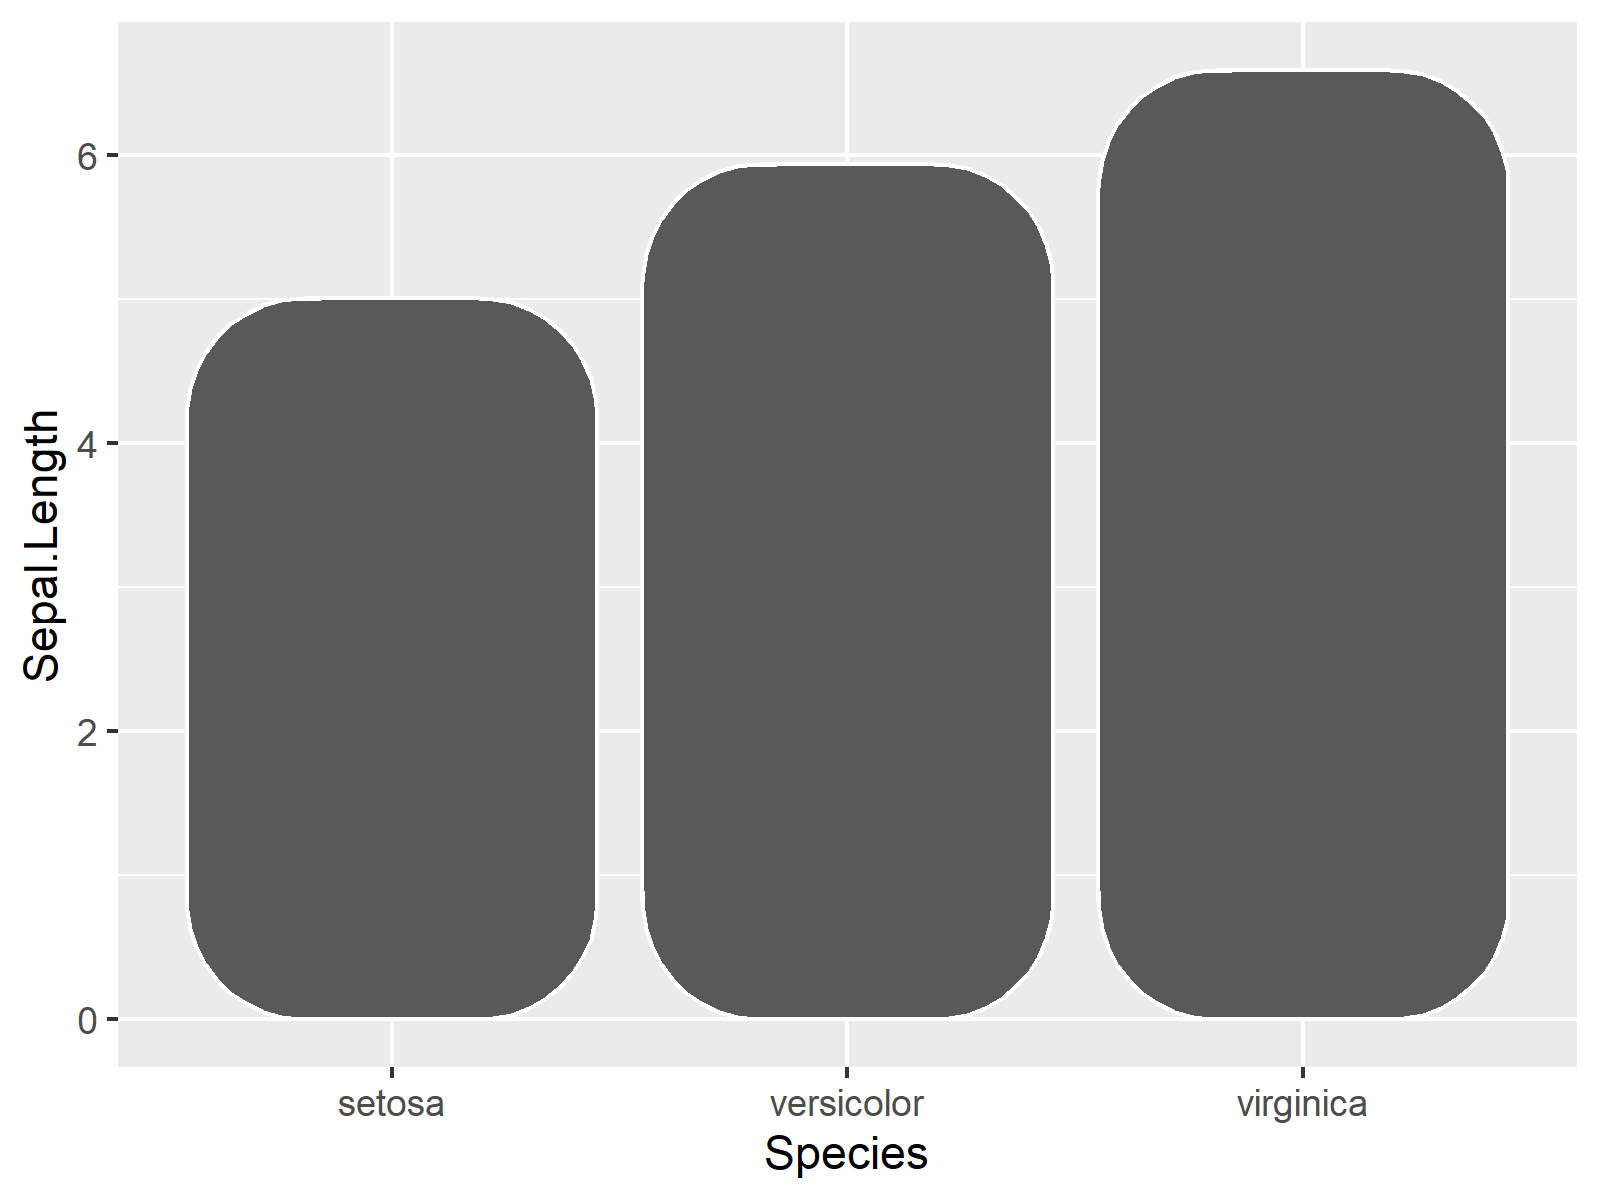
data(iris) # Example data iris_aggr <- aggregate(Sepal.Length ~ Species, iris, mean) iris_aggr # Species Sepal.Length # 1 setosa 5.006 # 2 versicolor 5.936 # 3 virginica 6.588 |
Example: Bars with Round Corners in ggplot2 Plot Using ggchicklet Package
install.packages("ggplot2") # Install ggplot2 package library("ggplot2") # Load ggplot2 |
install.packages("ggchicklet", repos = "https://cinc.rud.is") # Install ggchicklet package library("ggchicklet") # Load ggchicklet package |
ggplot(iris_aggr, # Bars with round corners aes(x = Species, y = Sepal.Length)) + geom_chicklet(radius = grid::unit(10, "mm")) |
Related Articles
You may find some related tutorials on topics such as ggplot2, variables, distributions, and graphics in R in the following list: