Create Boxplot with Previously Calculated Statisitics in R (2 Examples)
In this article, I’ll explain how to create a boxplot with previously calculated statisitics in R programming.
Example 1: Drawing a Boxplot from Pre-Calculated Values Using Base R
base_list <- list(stats = matrix(11:15, ncol = 1), # Create list with stats n = 5) base_list # $stats # [,1] # [1,] 11 # [2,] 12 # [3,] 13 # [4,] 14 # [5,] 15 # # $n # [1] 5 |
base_list <- list(stats = matrix(11:15, ncol = 1), # Create list with stats n = 5) base_list # $stats # [,1] # [1,] 11 # [2,] 12 # [3,] 13 # [4,] 14 # [5,] 15 # # $n # [1] 5
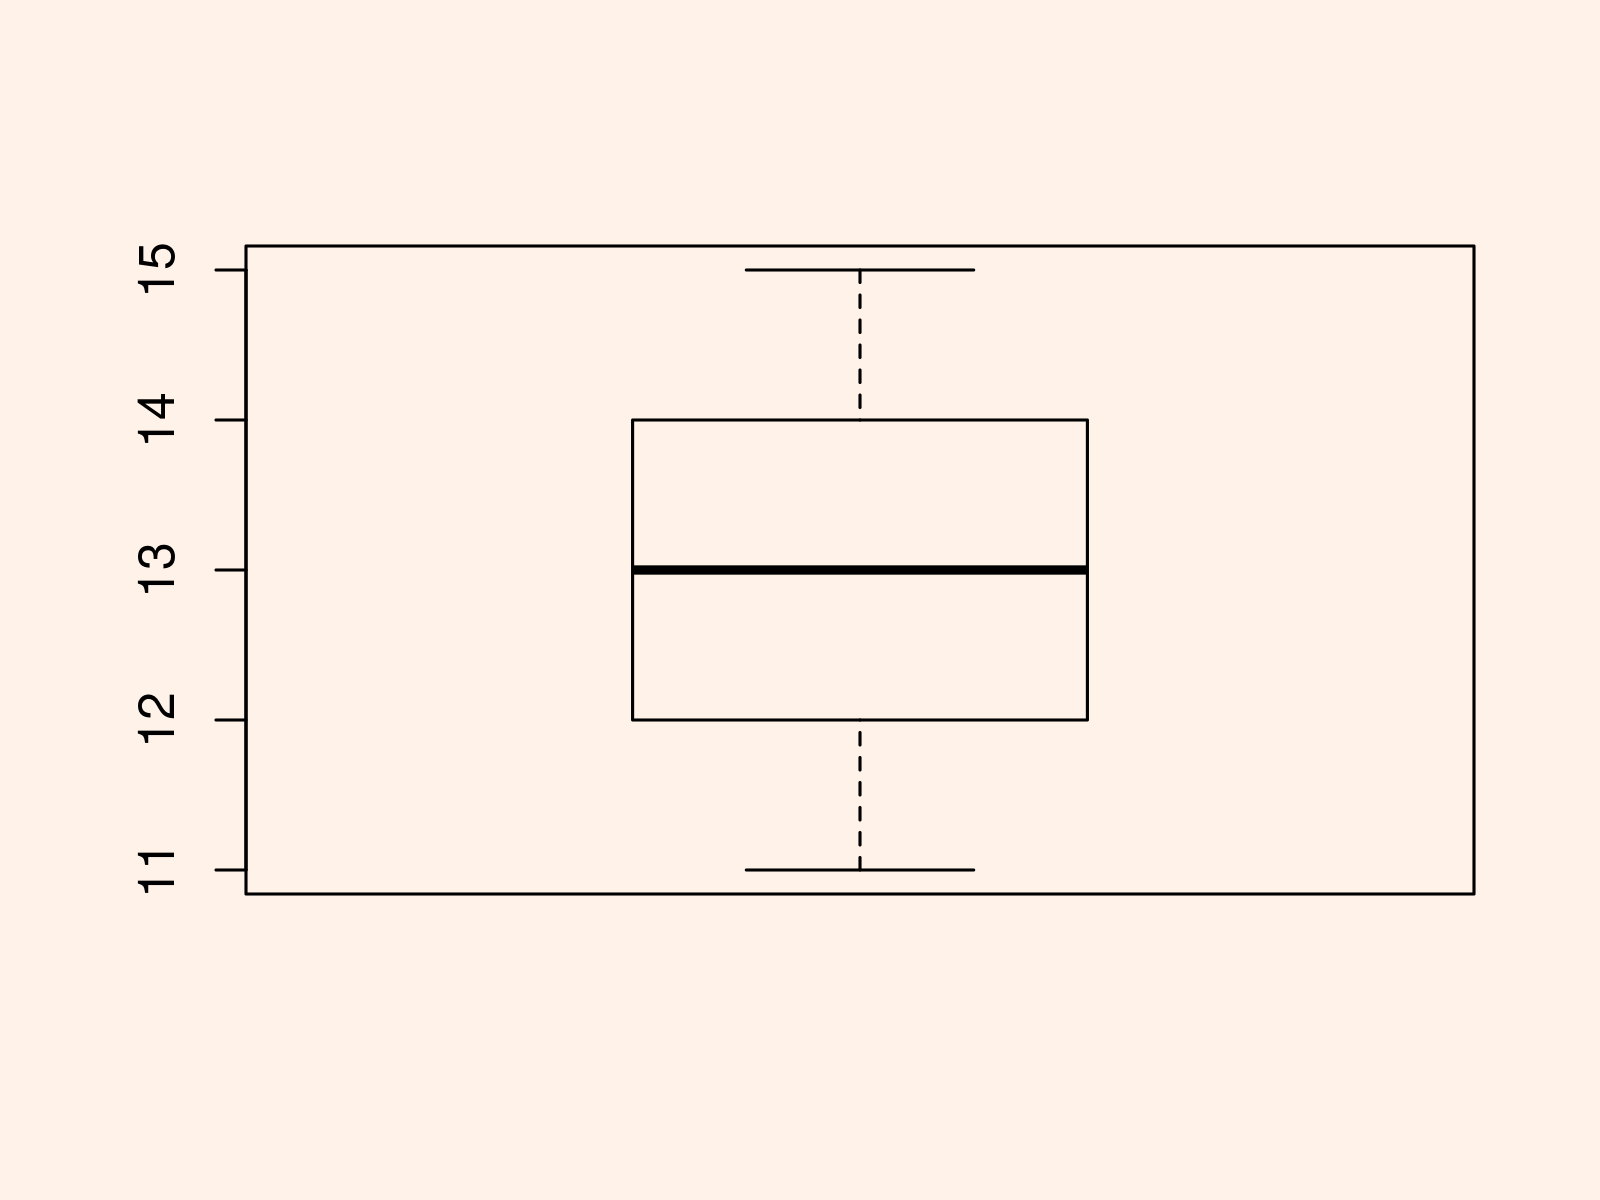
bxp(base_list) # Base R boxplot with precomputed values |
bxp(base_list) # Base R boxplot with precomputed values

Example 2: Drawing a Boxplot from Pre-Calculated Values Using the ggplot2 Package
install.packages("ggplot2") # Install & load ggplot2 library("ggplot2") |
install.packages("ggplot2") # Install & load ggplot2 library("ggplot2")
ggplot_data <- data.frame(x = "x", # Create data frame with stats ymin = 11, lower = 12, middle = 13, upper = 14, ymax = 15) ggplot_data # x ymin lower middle upper ymax # 1 x 11 12 13 14 15 |
ggplot_data <- data.frame(x = "x", # Create data frame with stats ymin = 11, lower = 12, middle = 13, upper = 14, ymax = 15) ggplot_data # x ymin lower middle upper ymax # 1 x 11 12 13 14 15
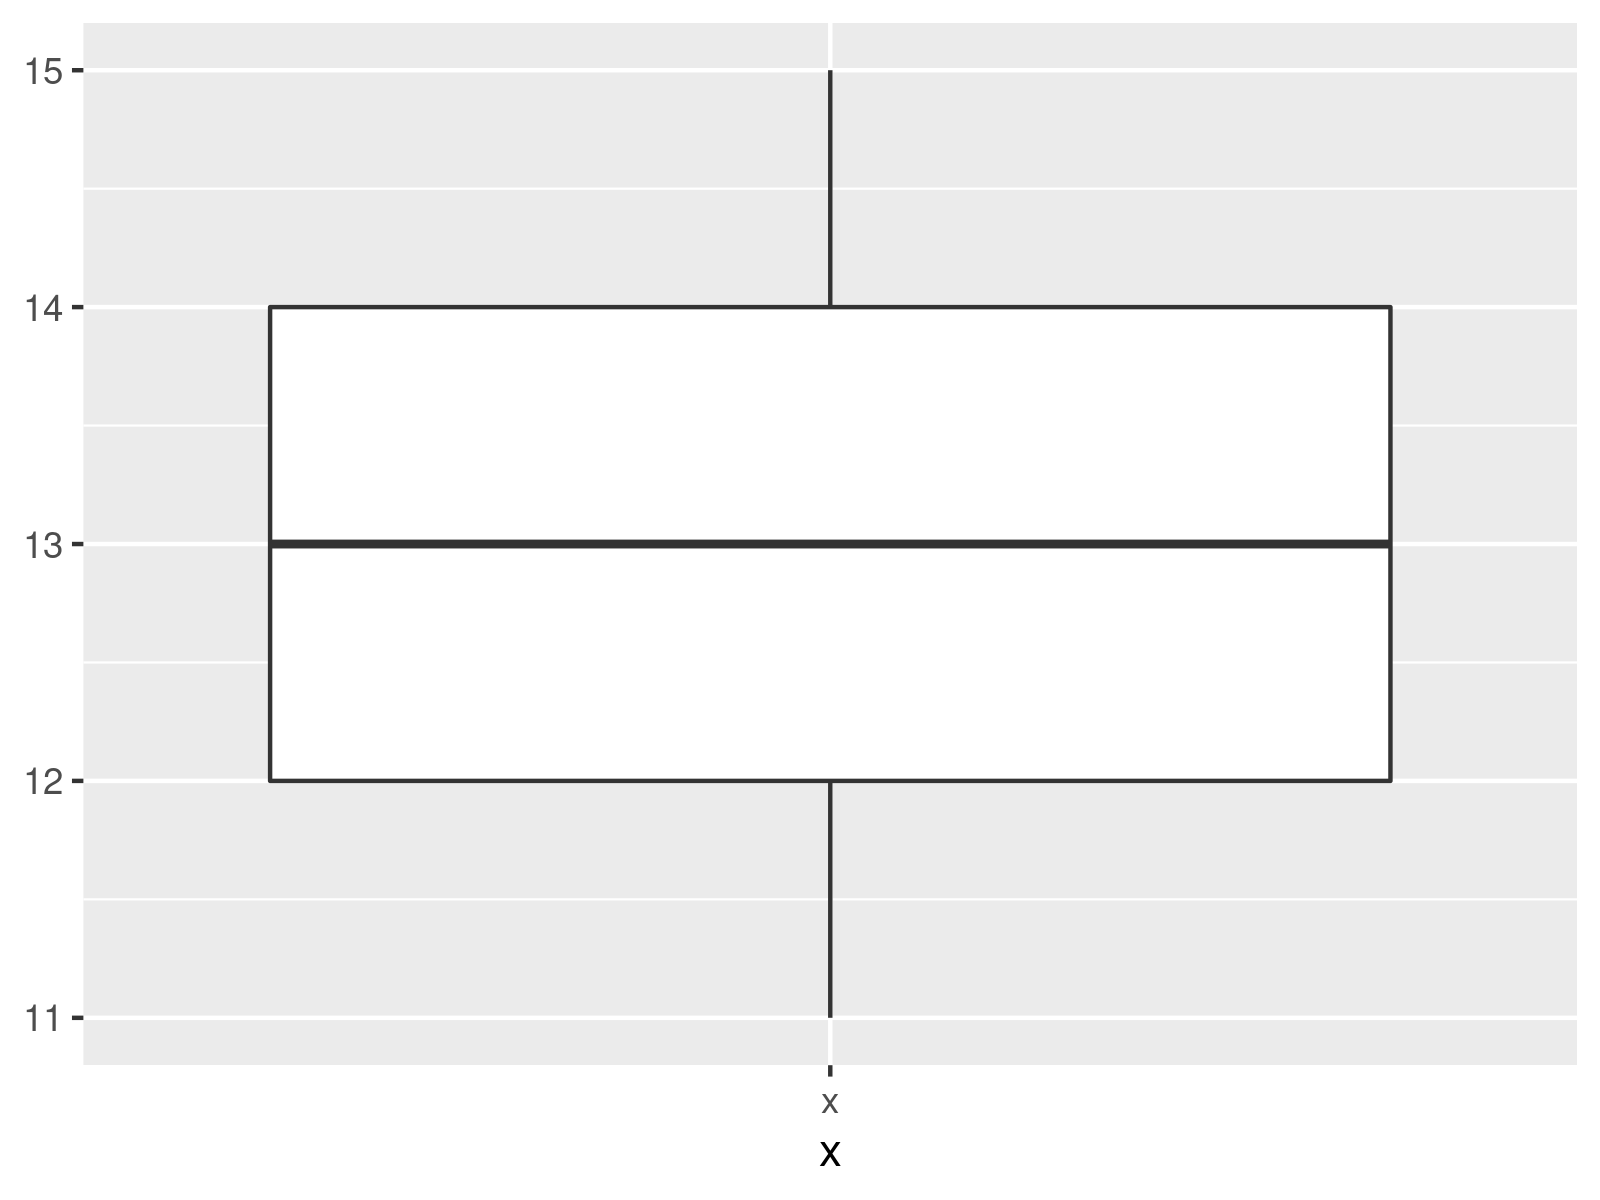
ggplot(ggplot_data, # ggplot2 boxplot with precomputed values aes(x = x, ymin = ymin, lower = lower, middle = middle, upper = upper, ymax = ymax)) + geom_boxplot(stat = "identity") |
ggplot(ggplot_data, # ggplot2 boxplot with precomputed values aes(x = x, ymin = ymin, lower = lower, middle = middle, upper = upper, ymax = ymax)) + geom_boxplot(stat = "identity")

Related Articles & Further Resources
Below, you can find some additional resources on topics such as coding errors, ggplot2, and distributions:
