How to Create a Boxplot with Means in R (2 Examples)
In this article you’ll learn how to draw a box-whisker-plot with mean values in R.
Setting up the Examples
data(iris) # Loading iris data head(iris) # Sepal.Length Sepal.Width Petal.Length Petal.Width Species # 1 5.1 3.5 1.4 0.2 setosa # 2 4.9 3.0 1.4 0.2 setosa # 3 4.7 3.2 1.3 0.2 setosa # 4 4.6 3.1 1.5 0.2 setosa # 5 5.0 3.6 1.4 0.2 setosa # 6 5.4 3.9 1.7 0.4 setosa |
data(iris) # Loading iris data head(iris) # Sepal.Length Sepal.Width Petal.Length Petal.Width Species # 1 5.1 3.5 1.4 0.2 setosa # 2 4.9 3.0 1.4 0.2 setosa # 3 4.7 3.2 1.3 0.2 setosa # 4 4.6 3.1 1.5 0.2 setosa # 5 5.0 3.6 1.4 0.2 setosa # 6 5.4 3.9 1.7 0.4 setosa
Example 1: Use Base R to Create Boxplot with Mean Values
iris_means <- aggregate(iris$Sepal.Length, # Calculate means list(iris$Species), mean) |
iris_means <- aggregate(iris$Sepal.Length, # Calculate means list(iris$Species), mean)
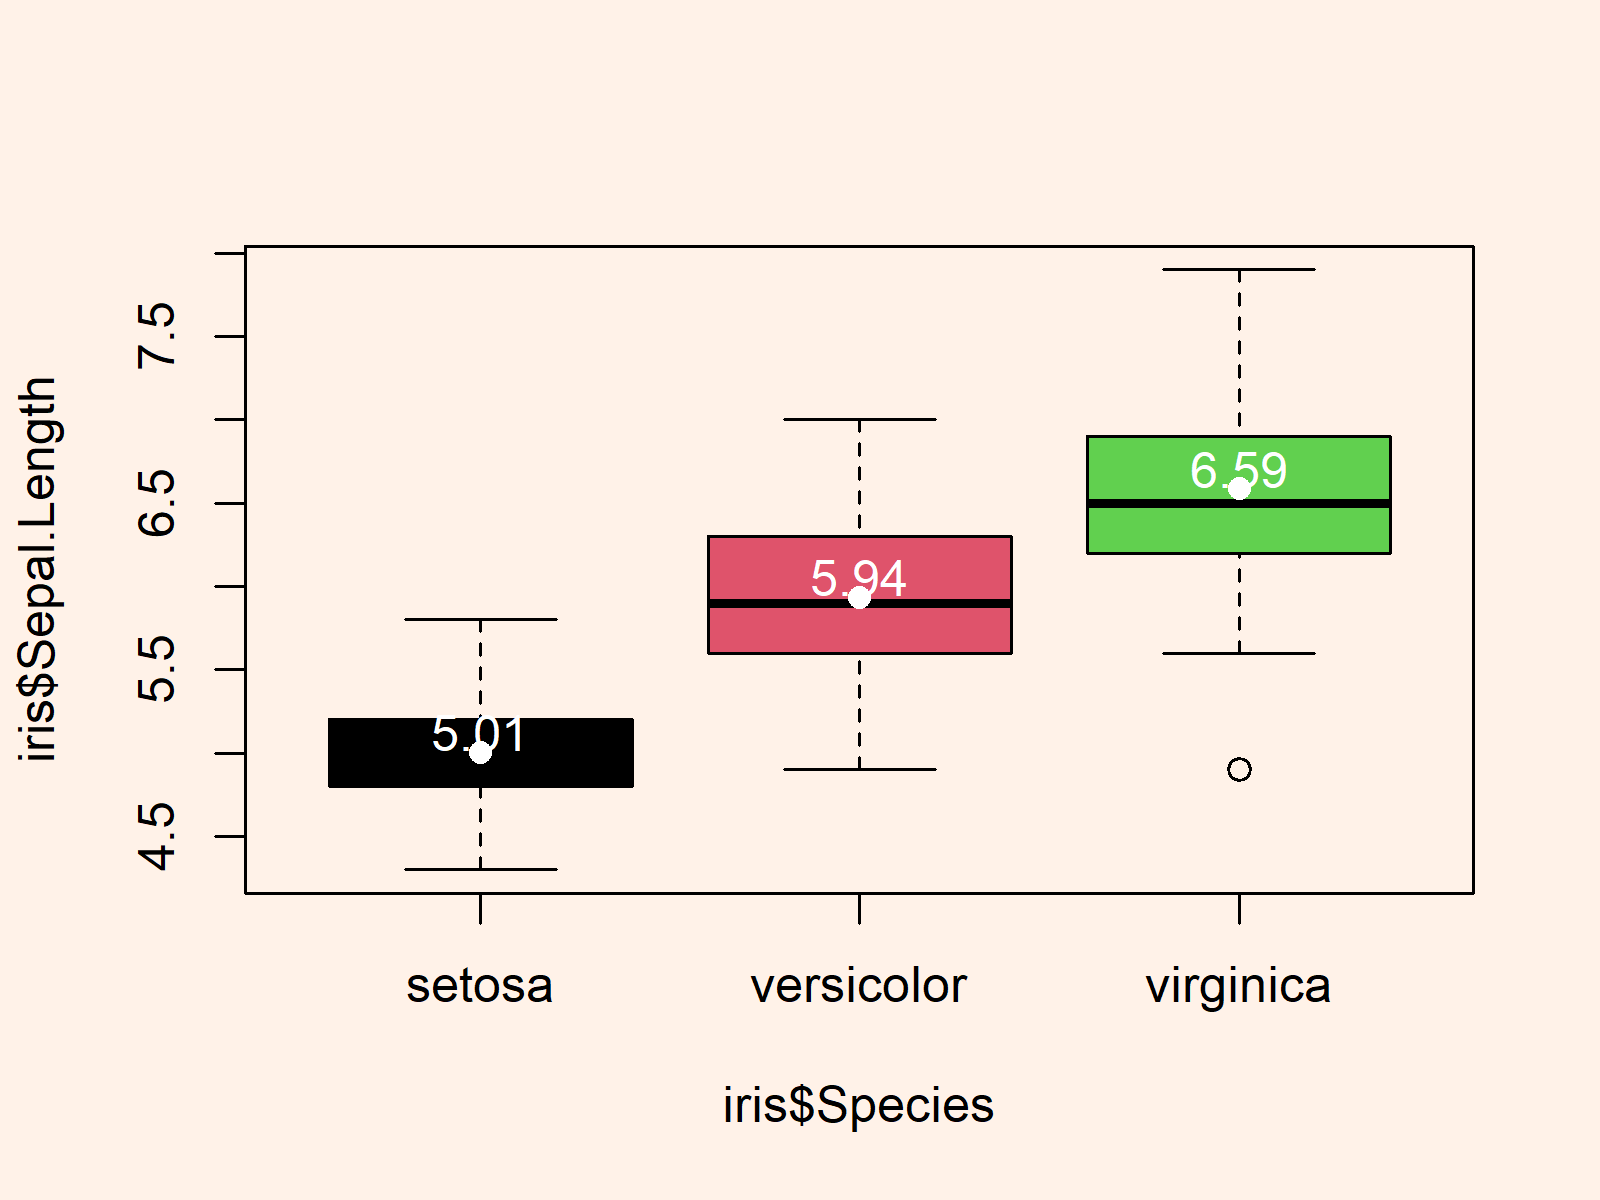
boxplot(iris$Sepal.Length ~ iris$Species, # Draw boxplot with means col = 1:3) points(x = 1:nrow(iris_means), y = iris_means$x, pch = 16, col = "white") text(x = 1:nrow(iris_means), y = iris_means$x + 0.12, labels = round(iris_means$x, 2), col = "white") |
boxplot(iris$Sepal.Length ~ iris$Species, # Draw boxplot with means col = 1:3) points(x = 1:nrow(iris_means), y = iris_means$x, pch = 16, col = "white") text(x = 1:nrow(iris_means), y = iris_means$x + 0.12, labels = round(iris_means$x, 2), col = "white")

Example 2: Use ggplot2 Package to Create Boxplot with Mean Values
install.packages("ggplot2") # Install & load ggplot2 package library("ggplot2") |
install.packages("ggplot2") # Install & load ggplot2 package library("ggplot2")
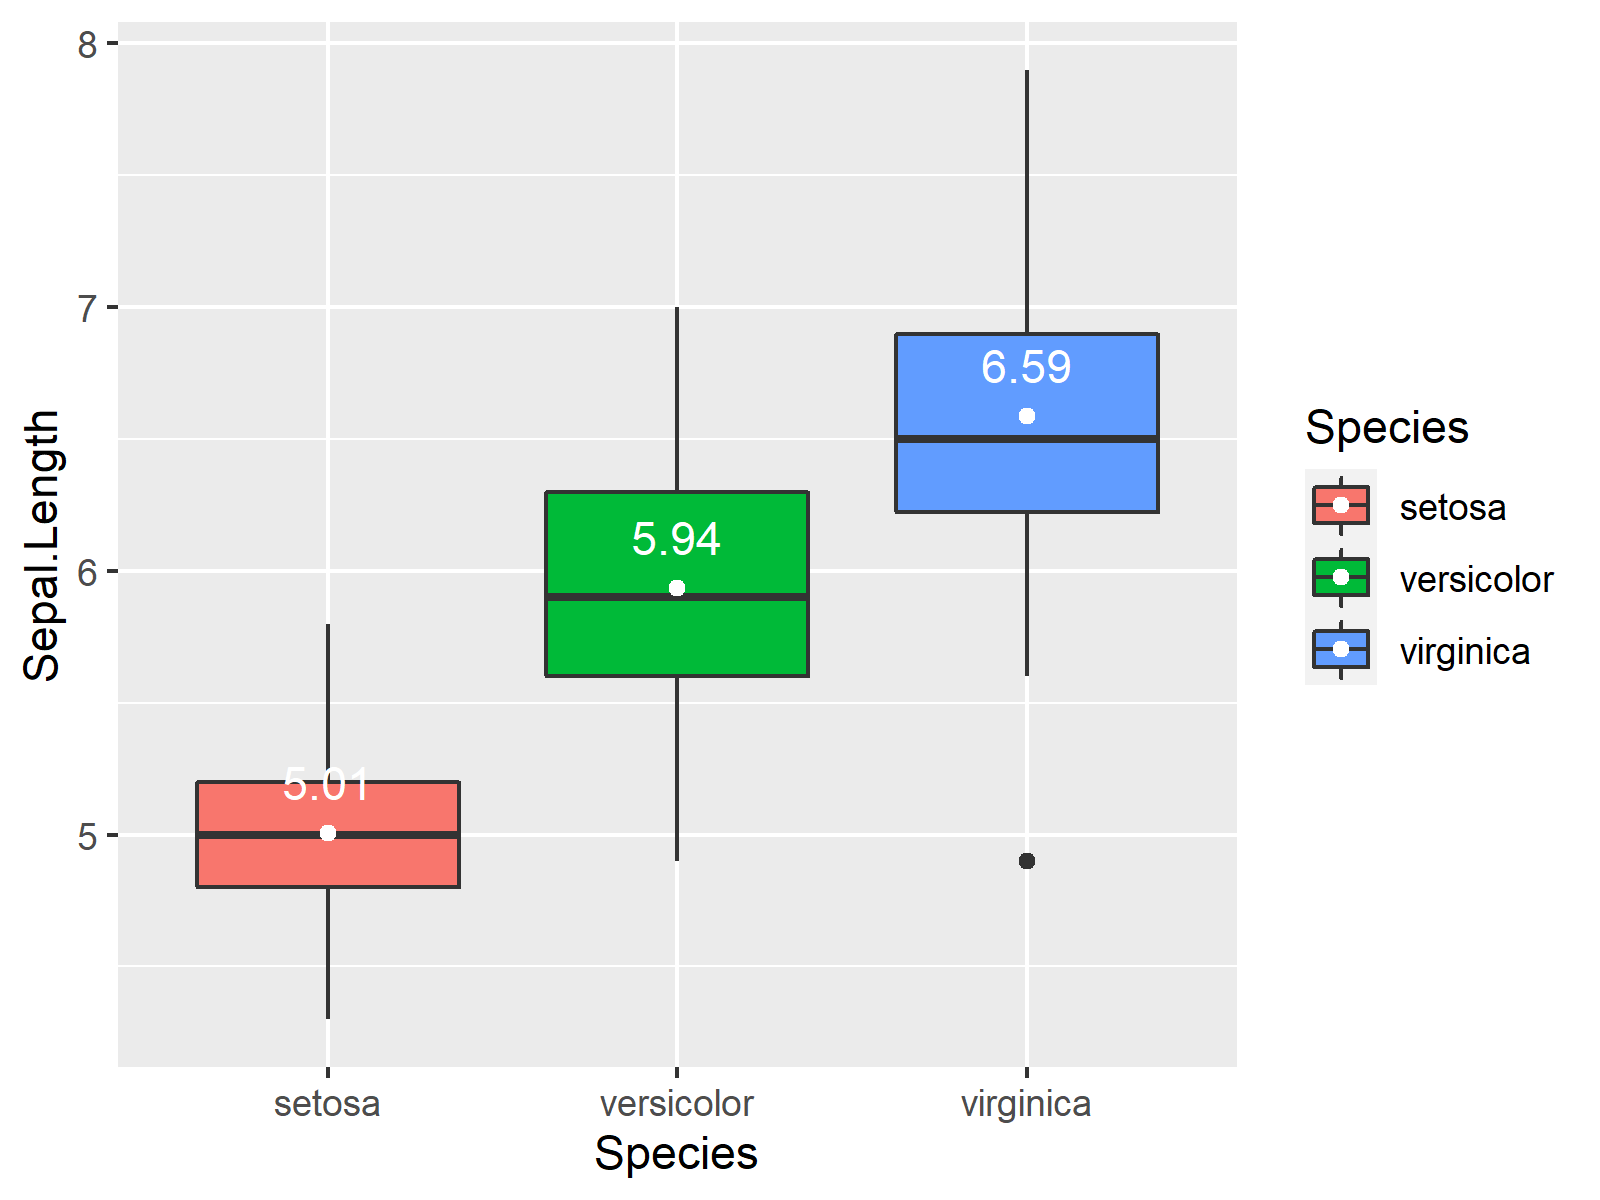
ggplot(iris, # Draw boxplot with means aes(x = Species, y = Sepal.Length, fill = Species)) + geom_boxplot() + stat_summary(fun = mean, col = "white", geom = "point") + stat_summary(fun = mean, col = "white", geom = "text", vjust = - 1, aes(label = round(..y.., digits = 2))) |
ggplot(iris, # Draw boxplot with means aes(x = Species, y = Sepal.Length, fill = Species)) + geom_boxplot() + stat_summary(fun = mean, col = "white", geom = "point") + stat_summary(fun = mean, col = "white", geom = "text", vjust = - 1, aes(label = round(..y.., digits = 2)))

