How to Modify ggplot2 Plot Area Margins in R Programming (Example Code)
In this tutorial, I’ll illustrate how to change the area margins of a ggplot2 graph in the R programming language.
Setting up the Example
data(iris) # Our data head(iris) # Head of data # Sepal.Length Sepal.Width Petal.Length Petal.Width Species # 1 5.1 3.5 1.4 0.2 setosa # 2 4.9 3.0 1.4 0.2 setosa # 3 4.7 3.2 1.3 0.2 setosa # 4 4.6 3.1 1.5 0.2 setosa # 5 5.0 3.6 1.4 0.2 setosa # 6 5.4 3.9 1.7 0.4 setosa |
install.packages("ggplot2") # Install & load ggplot2 library("ggplot2") |
our_ggplot <- ggplot(iris, aes(x = Petal.Length, y = Petal.Width, y)) + # Default margins of plot geom_point() our_ggplot # Drawing the graph |

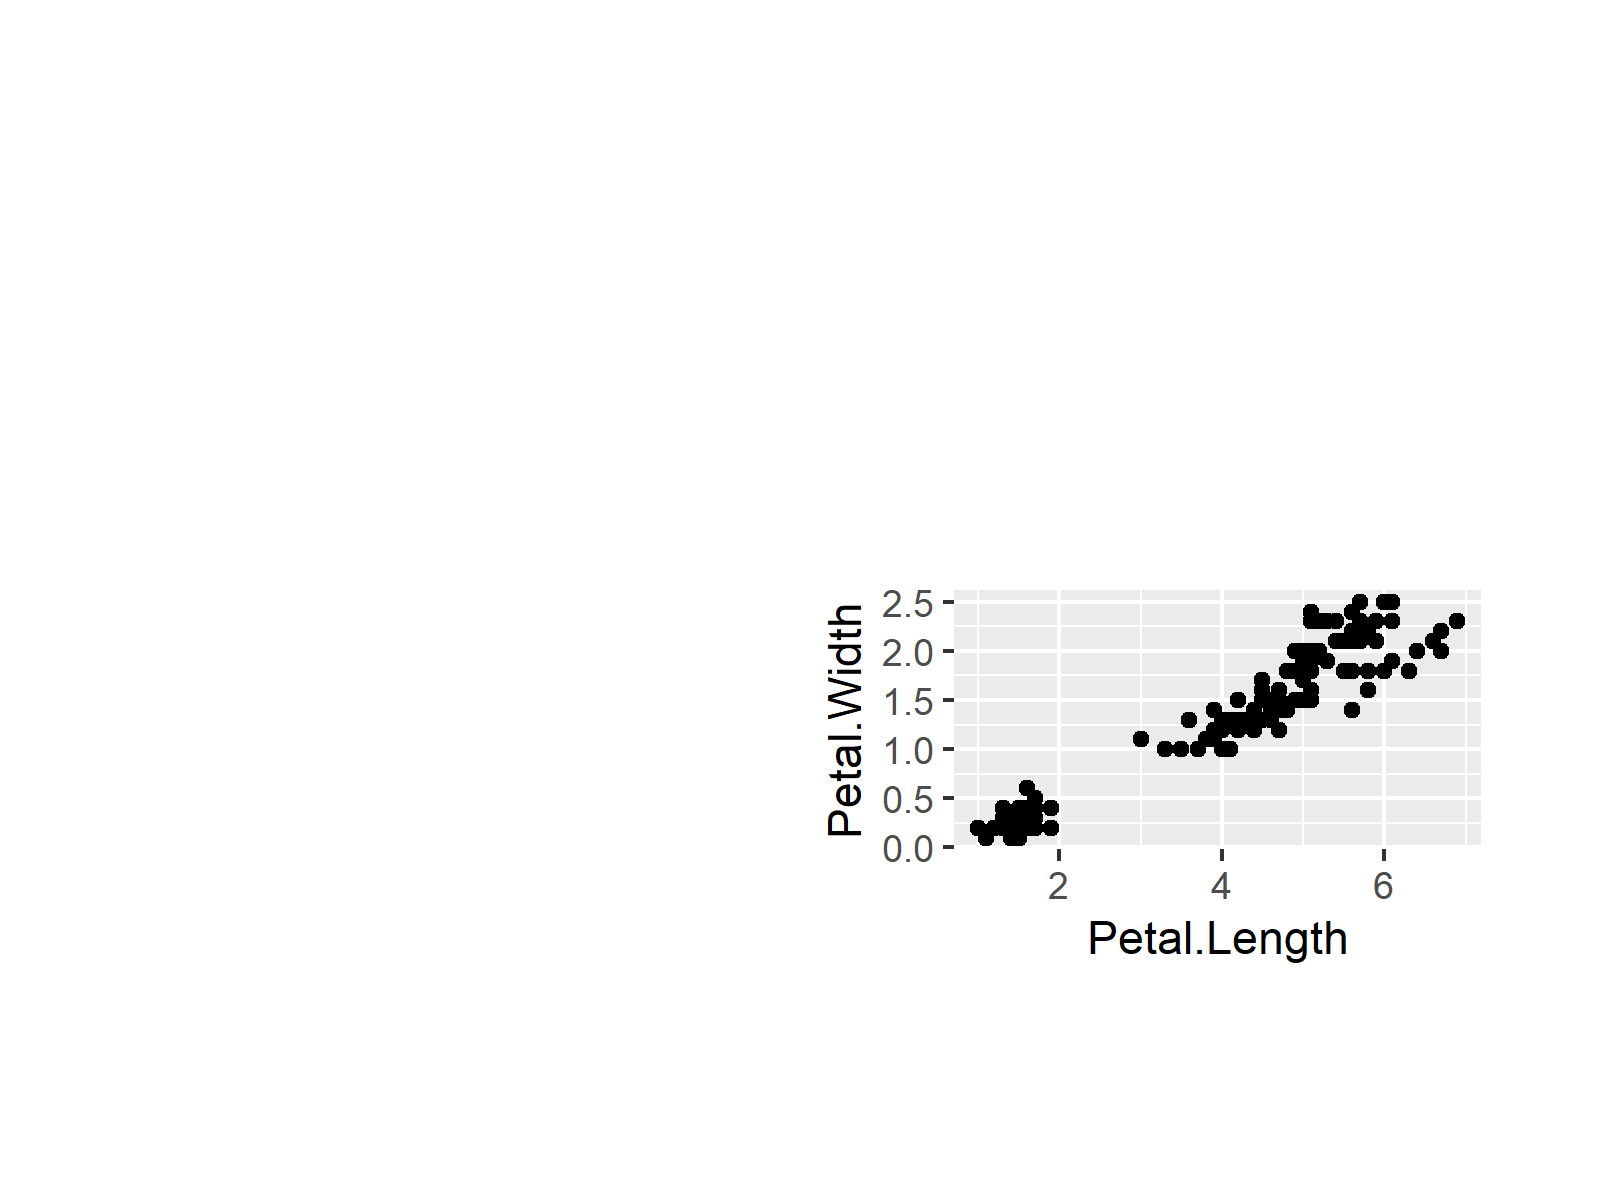
Example: Adjusting Margins of ggplot2 Plot
our_ggplot + # Modify margins of ggplot2 graphic theme(plot.margin = unit(c(5, 1, 2, 7), "cm")) |