How to Apply the mtext() Function in R (Example Code)
This tutorial explains how to annotate text elements to the margins of a graphic using the mtext function in the R programming language.
Constructing Example Data
data(iris) # Load example data head(iris) # Sepal.Length Sepal.Width Petal.Length Petal.Width Species # 1 5.1 3.5 1.4 0.2 setosa # 2 4.9 3.0 1.4 0.2 setosa # 3 4.7 3.2 1.3 0.2 setosa # 4 4.6 3.1 1.5 0.2 setosa # 5 5.0 3.6 1.4 0.2 setosa # 6 5.4 3.9 1.7 0.4 setosa |
data(iris) # Load example data head(iris) # Sepal.Length Sepal.Width Petal.Length Petal.Width Species # 1 5.1 3.5 1.4 0.2 setosa # 2 4.9 3.0 1.4 0.2 setosa # 3 4.7 3.2 1.3 0.2 setosa # 4 4.6 3.1 1.5 0.2 setosa # 5 5.0 3.6 1.4 0.2 setosa # 6 5.4 3.9 1.7 0.4 setosa
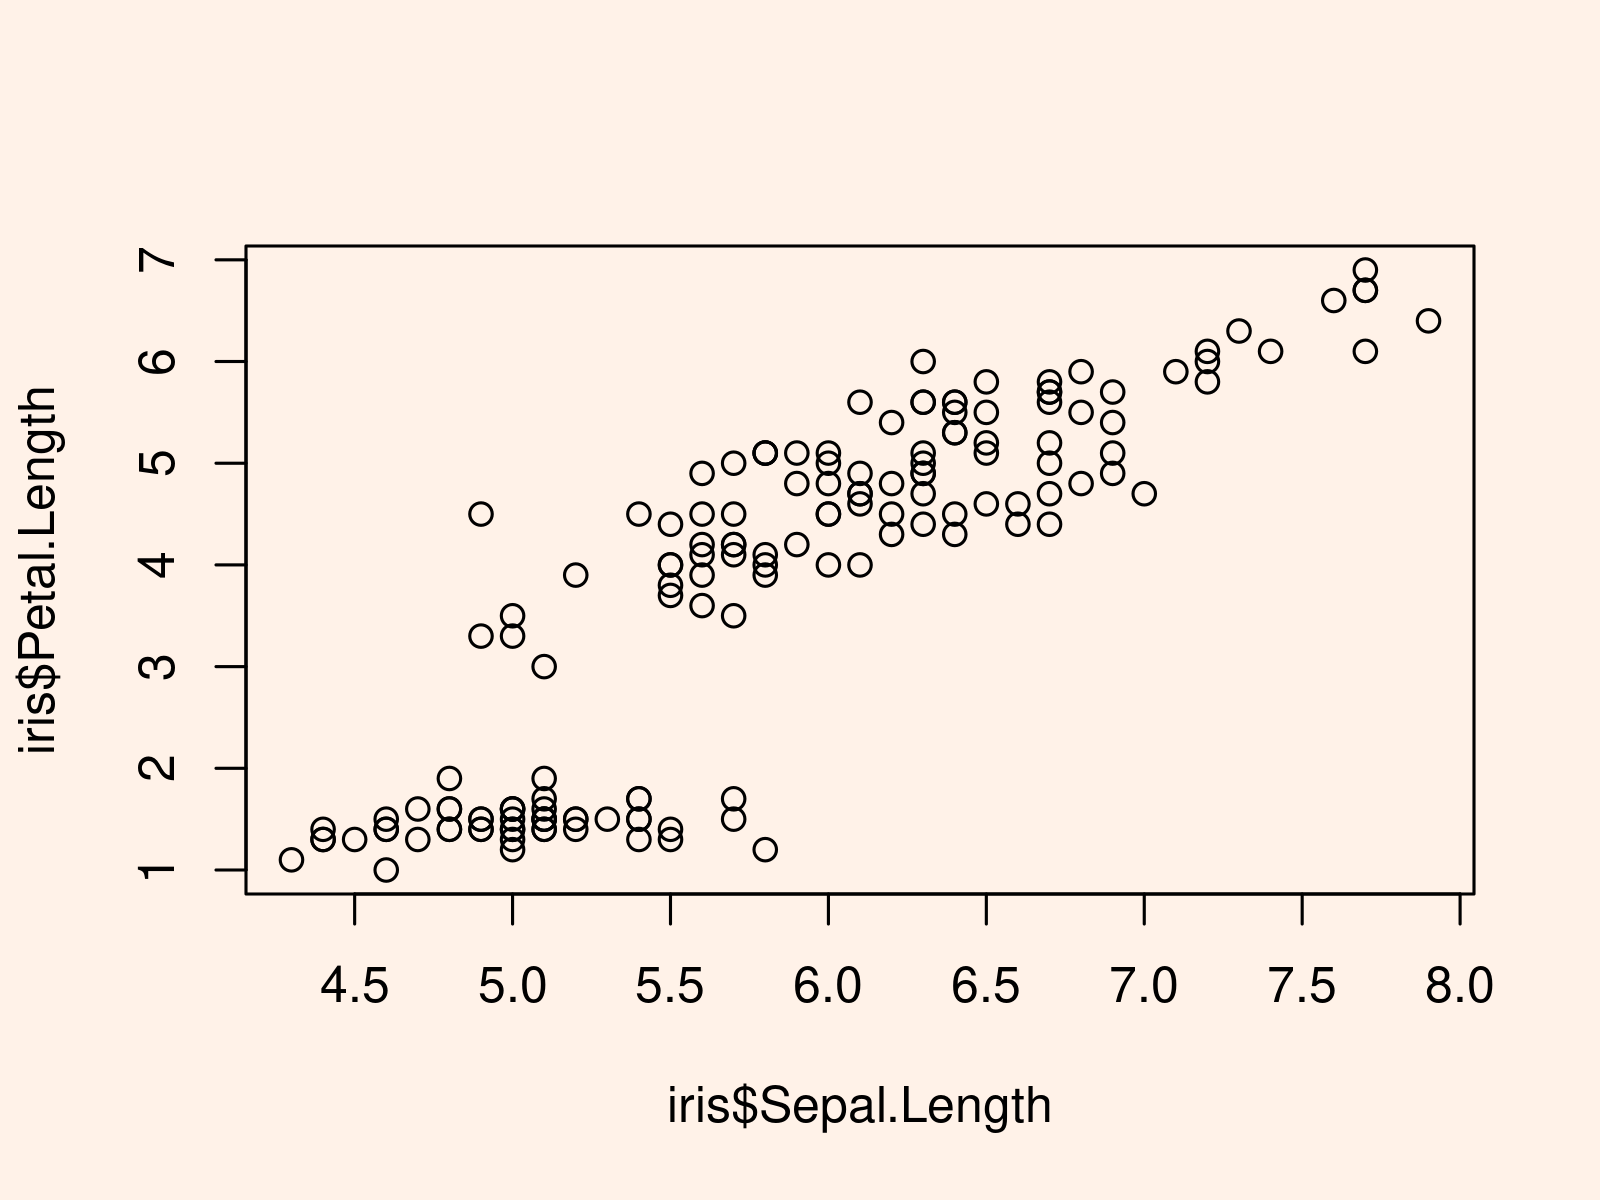
plot(iris$Sepal.Length, # Base R scatterplot iris$Petal.Length) |
plot(iris$Sepal.Length, # Base R scatterplot iris$Petal.Length)

Example: Basic Application of mtext() Function
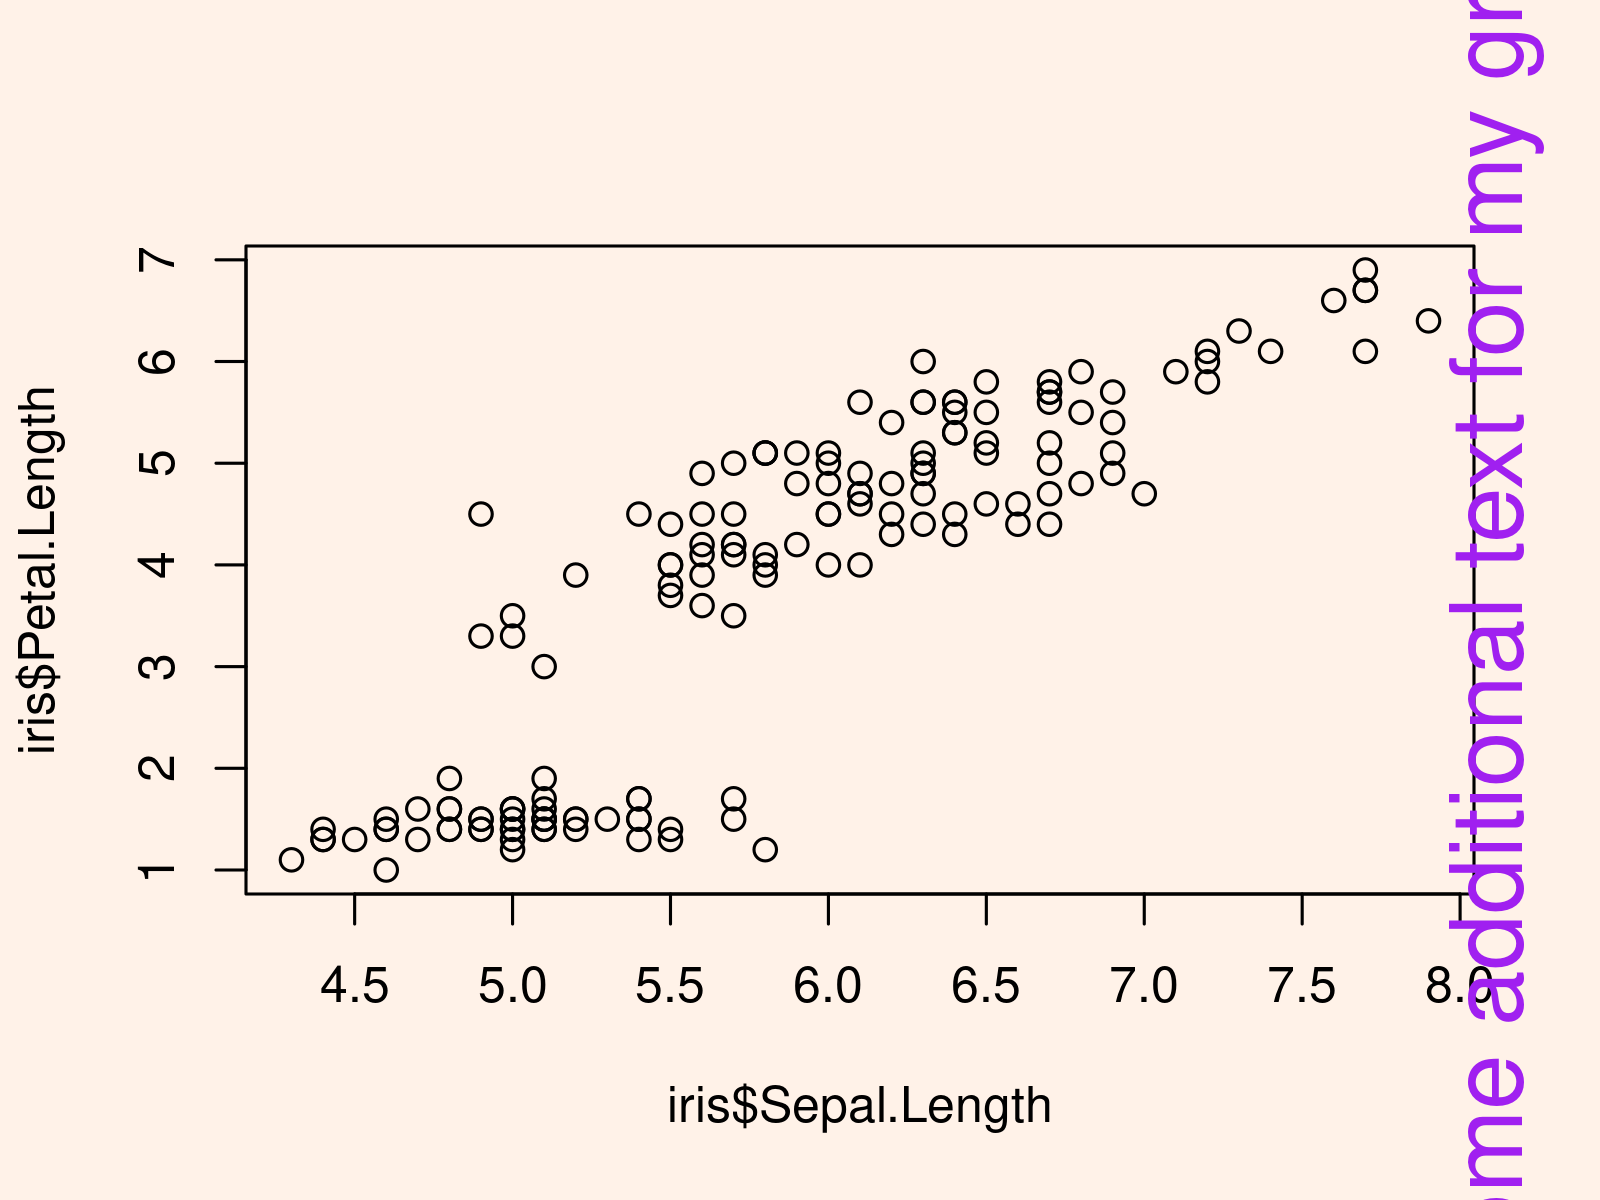
plot(iris$Sepal.Length, # Base R scatterplot iris$Petal.Length) mtext("Some additional text for my graph", # Annotate text to plot side = 4, col = "purple", cex = 2) |
plot(iris$Sepal.Length, # Base R scatterplot iris$Petal.Length) mtext("Some additional text for my graph", # Annotate text to plot side = 4, col = "purple", cex = 2)

