Drawing Stacked ggplot2 Barchart in R (Example Code)
This tutorial shows how to create a stacked barchart in the R programming language.
Preparing the Example
data(iris) # Creating example data iris$group <- letters[1:5] iris <- iris[ , c(1, 5, 6)] head(iris) # Show head of data set # Sepal.Length Species group # 1 5.1 setosa a # 2 4.9 setosa b # 3 4.7 setosa c # 4 4.6 setosa d # 5 5.0 setosa e # 6 5.4 setosa a |
data(iris) # Creating example data iris$group <- letters[1:5] iris <- iris[ , c(1, 5, 6)] head(iris) # Show head of data set # Sepal.Length Species group # 1 5.1 setosa a # 2 4.9 setosa b # 3 4.7 setosa c # 4 4.6 setosa d # 5 5.0 setosa e # 6 5.4 setosa a
Example: Drawing Stacked ggplot2 Barplot of Iris Flower Data
install.packages("ggplot2") # Install & load ggplot2 package library("ggplot2") |
install.packages("ggplot2") # Install & load ggplot2 package library("ggplot2")
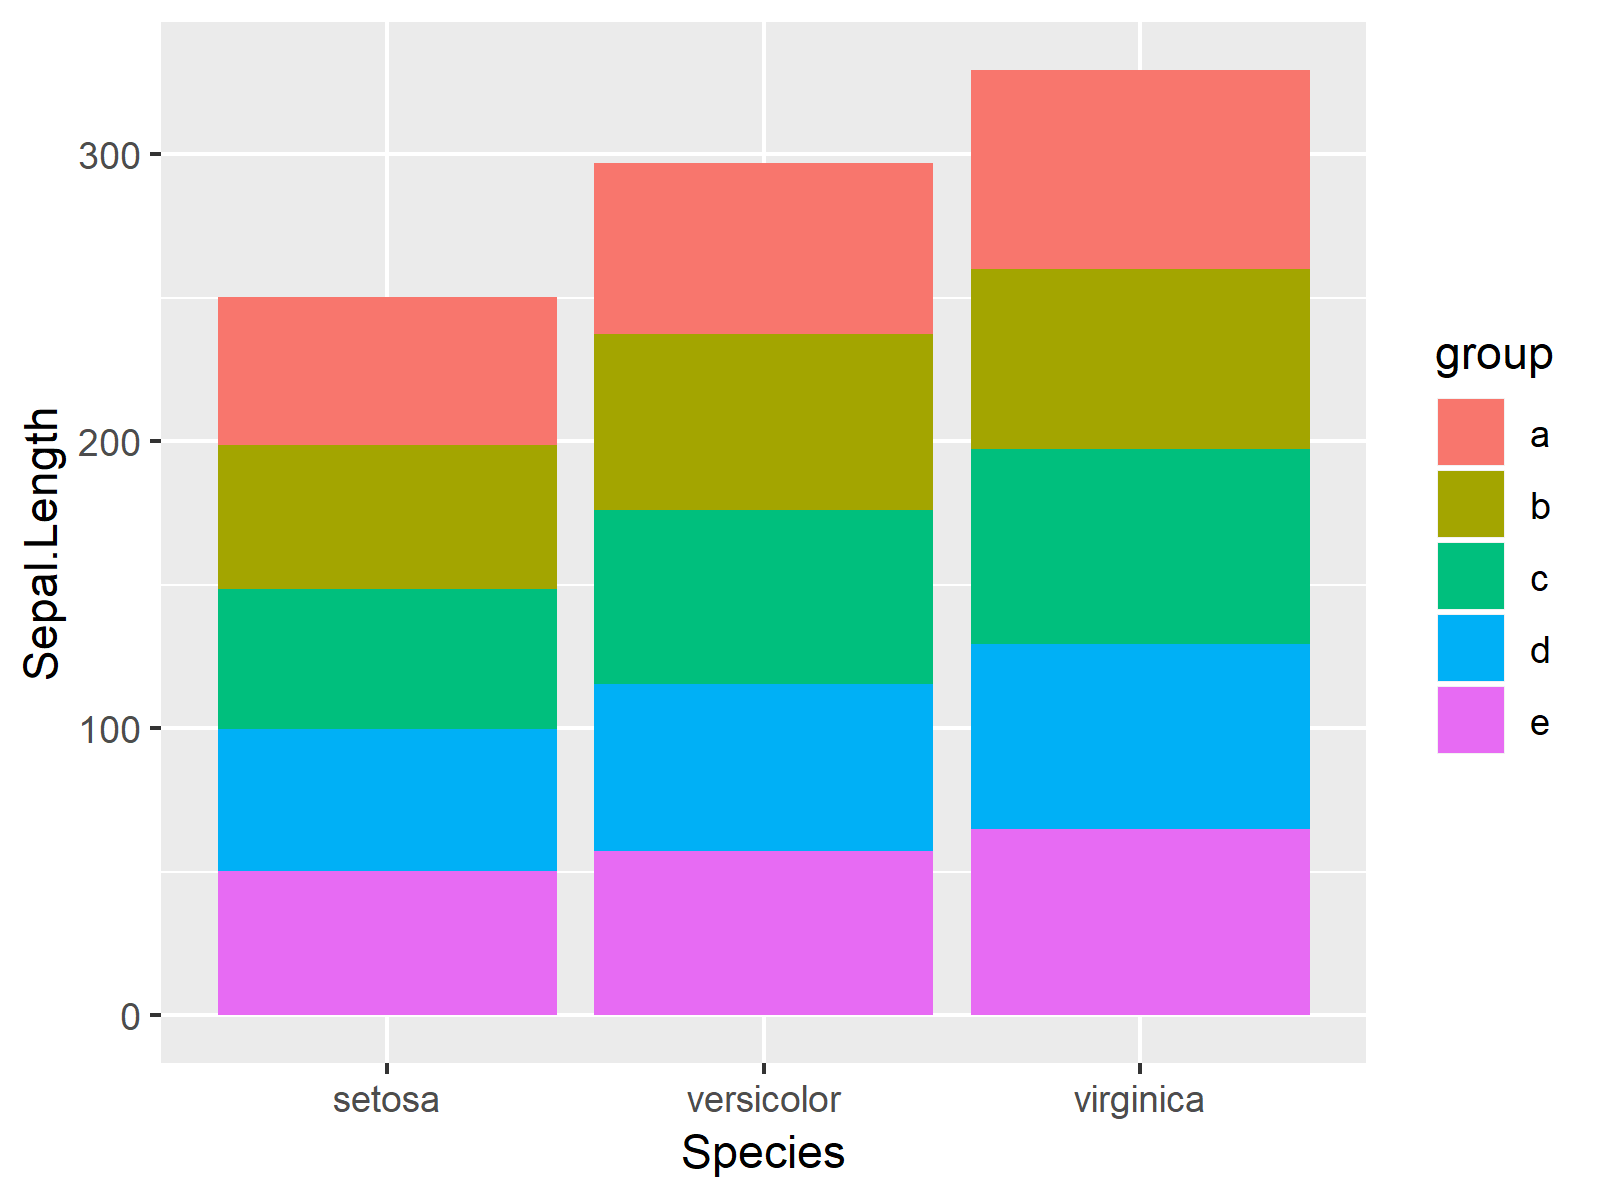
ggplot(iris, # Create stacked ggplot2 barplot aes(x = Species, y = Sepal.Length, fill = group)) + geom_bar(stat = "identity") |
ggplot(iris, # Create stacked ggplot2 barplot aes(x = Species, y = Sepal.Length, fill = group)) + geom_bar(stat = "identity")

