How to Apply the grid() Function in R (Example Code)
In this tutorial you’ll learn how to apply the grid function in R programming.
Creating Example Data
data(iris) # Example data head(iris) # Sepal.Length Sepal.Width Petal.Length Petal.Width Species # 1 5.1 3.5 1.4 0.2 setosa # 2 4.9 3.0 1.4 0.2 setosa # 3 4.7 3.2 1.3 0.2 setosa # 4 4.6 3.1 1.5 0.2 setosa # 5 5.0 3.6 1.4 0.2 setosa # 6 5.4 3.9 1.7 0.4 setosa |
data(iris) # Example data head(iris) # Sepal.Length Sepal.Width Petal.Length Petal.Width Species # 1 5.1 3.5 1.4 0.2 setosa # 2 4.9 3.0 1.4 0.2 setosa # 3 4.7 3.2 1.3 0.2 setosa # 4 4.6 3.1 1.5 0.2 setosa # 5 5.0 3.6 1.4 0.2 setosa # 6 5.4 3.9 1.7 0.4 setosa
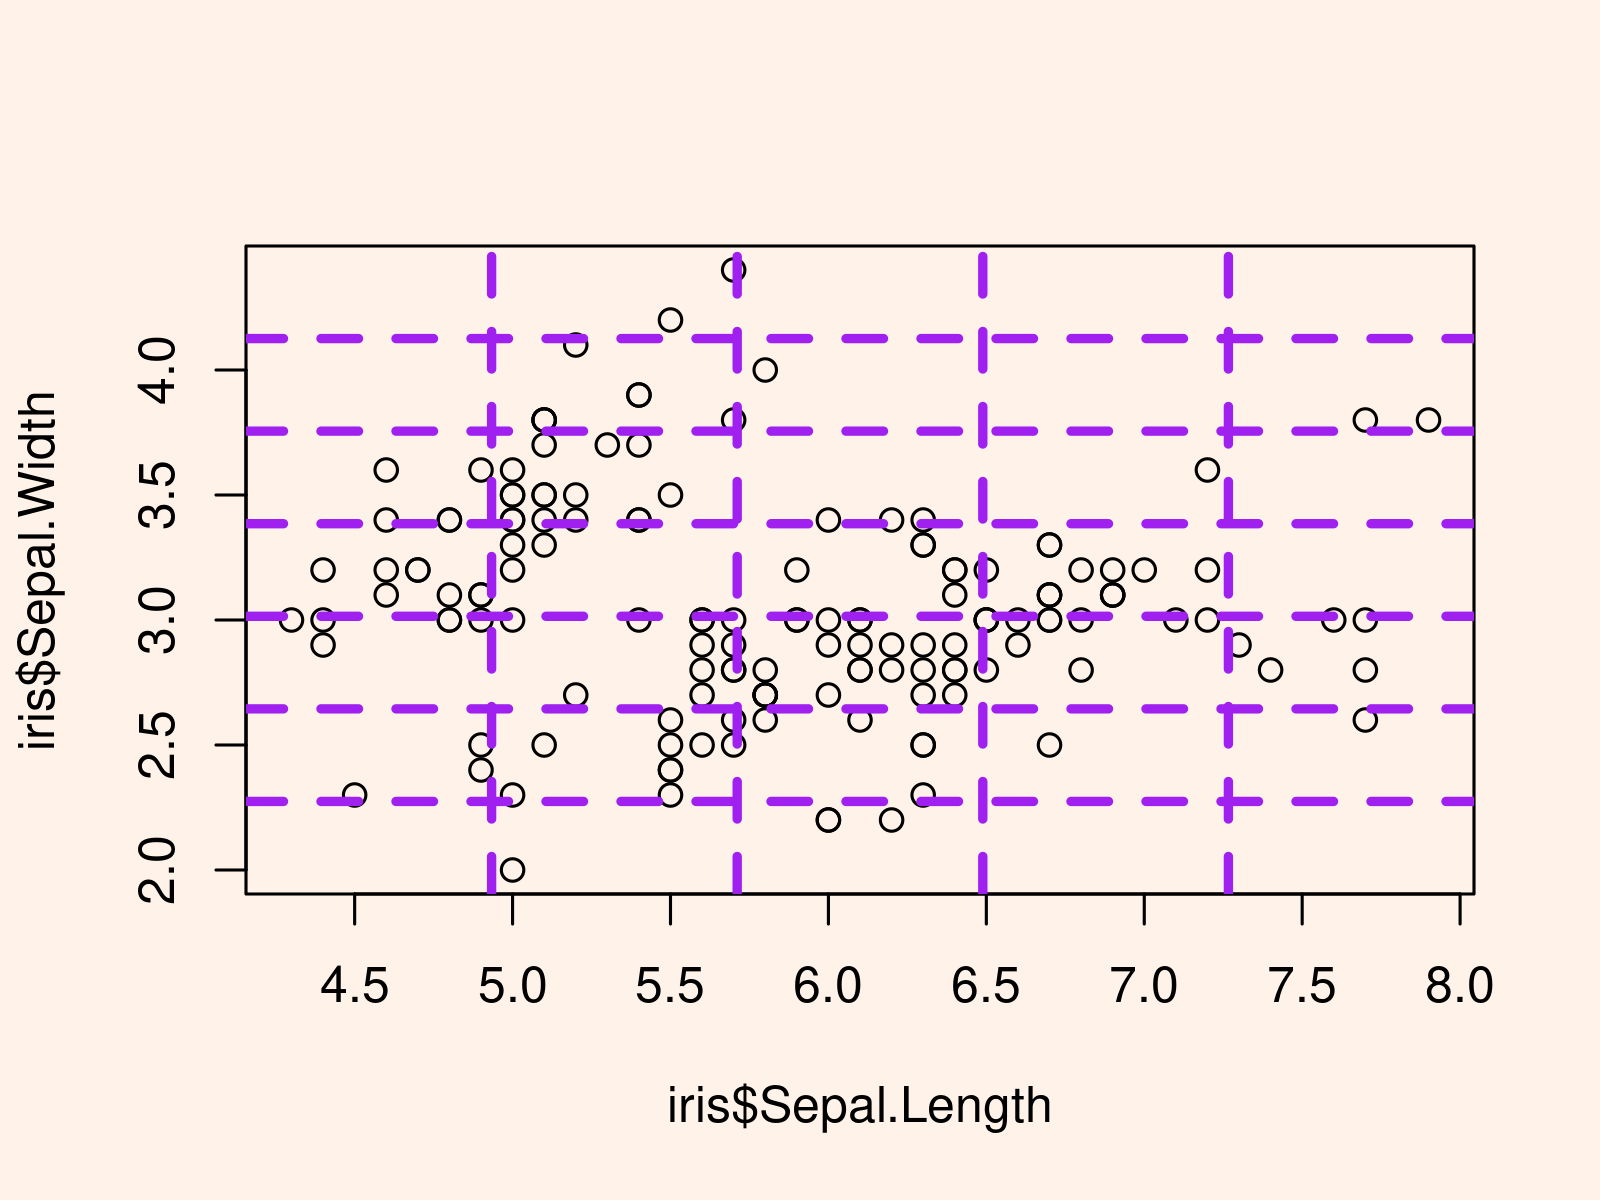
Example: Apply grid() Function to Add Grid on Top of Base R Plot
plot(iris$Sepal.Length, # Draw scatterplot of iris data iris$Sepal.Width) grid(5, 7, # Overlay grid with color & manual line type col = "purple", lty = "dashed", lwd = 3) |
plot(iris$Sepal.Length, # Draw scatterplot of iris data iris$Sepal.Width) grid(5, 7, # Overlay grid with color & manual line type col = "purple", lty = "dashed", lwd = 3)

