How to Apply the box() Function in R (2 Examples)
In this R article you’ll learn how to draw a border around a plot using the box function.
Example Data
data(iris) # Load example data head(iris) # Sepal.Length Sepal.Width Petal.Length Petal.Width Species # 1 5.1 3.5 1.4 0.2 setosa # 2 4.9 3.0 1.4 0.2 setosa # 3 4.7 3.2 1.3 0.2 setosa # 4 4.6 3.1 1.5 0.2 setosa # 5 5.0 3.6 1.4 0.2 setosa # 6 5.4 3.9 1.7 0.4 setosa |
data(iris) # Load example data head(iris) # Sepal.Length Sepal.Width Petal.Length Petal.Width Species # 1 5.1 3.5 1.4 0.2 setosa # 2 4.9 3.0 1.4 0.2 setosa # 3 4.7 3.2 1.3 0.2 setosa # 4 4.6 3.1 1.5 0.2 setosa # 5 5.0 3.6 1.4 0.2 setosa # 6 5.4 3.9 1.7 0.4 setosa
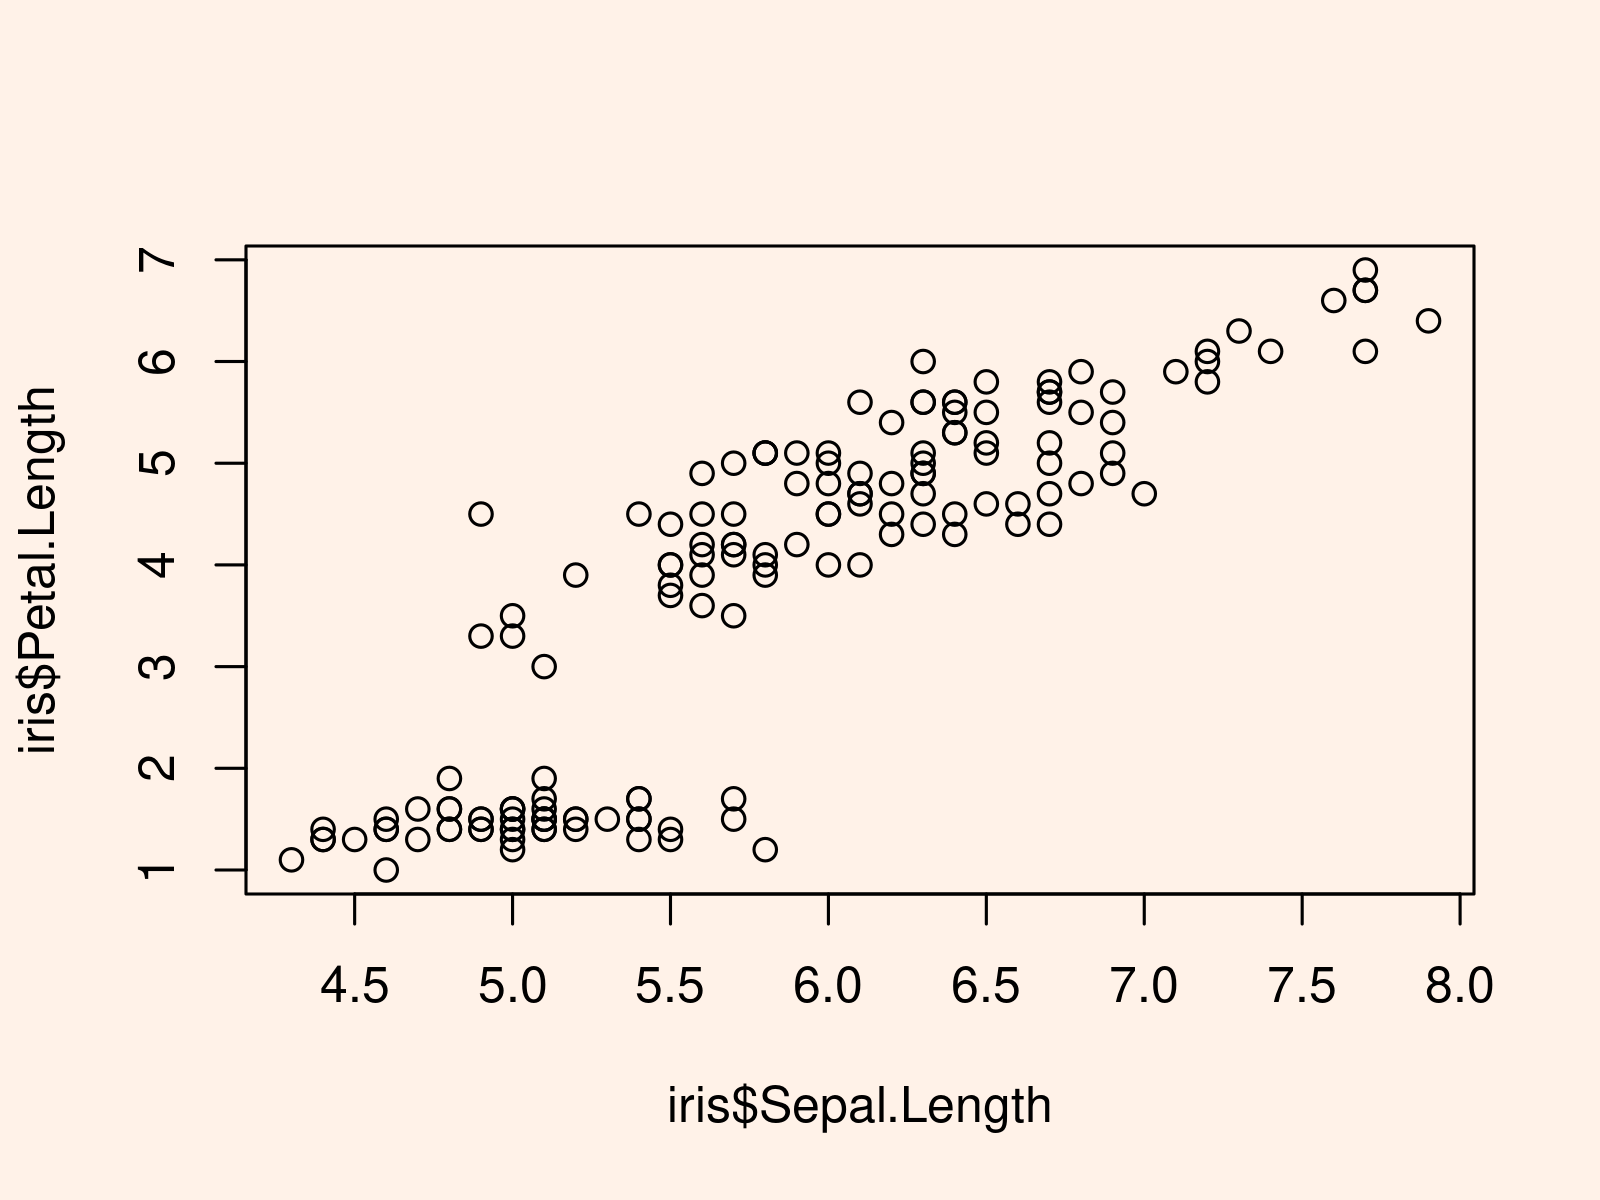
plot(x = iris$Sepal.Length, # Create plot without box y = iris$Petal.Length) |
plot(x = iris$Sepal.Length, # Create plot without box y = iris$Petal.Length)

Example 1: Draw Box Around Plot
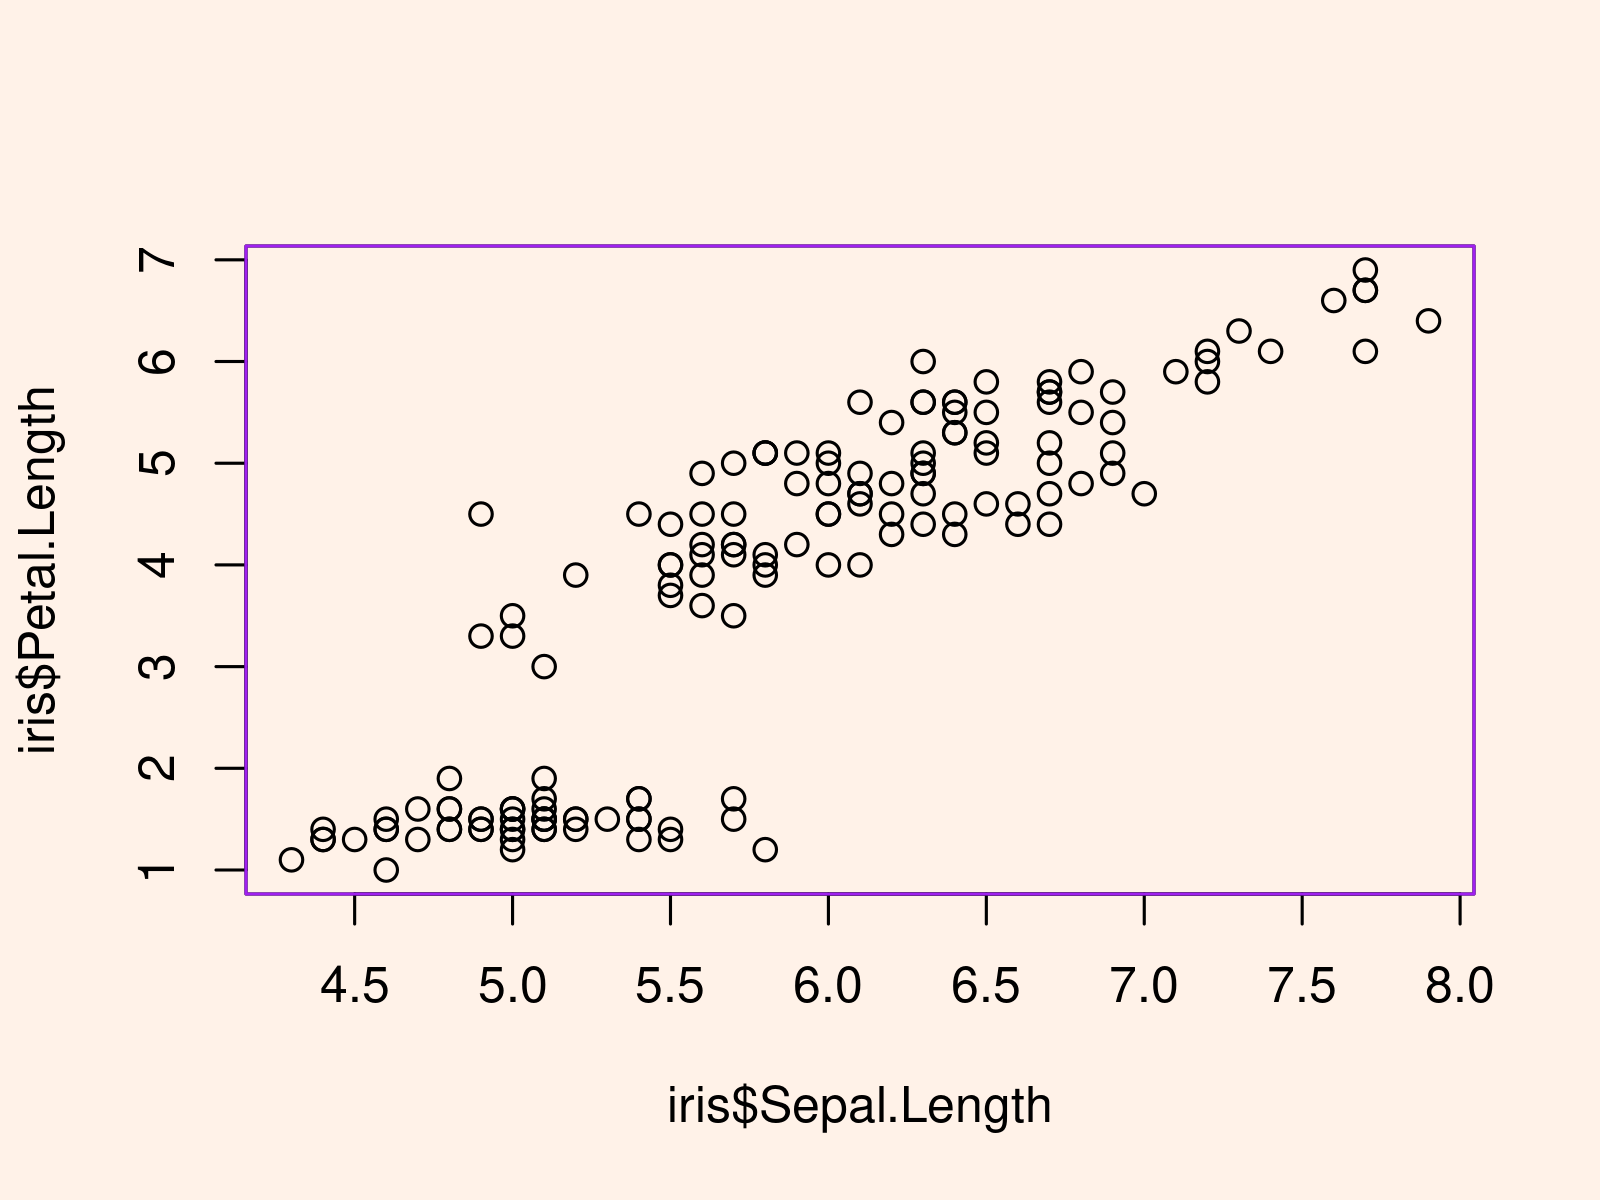
plot(x = iris$Sepal.Length, # Create plot without box y = iris$Petal.Length) box(col = "purple") # Adding a box around the plot |
plot(x = iris$Sepal.Length, # Create plot without box y = iris$Petal.Length) box(col = "purple") # Adding a box around the plot

Example 2: Draw Box Around Figure
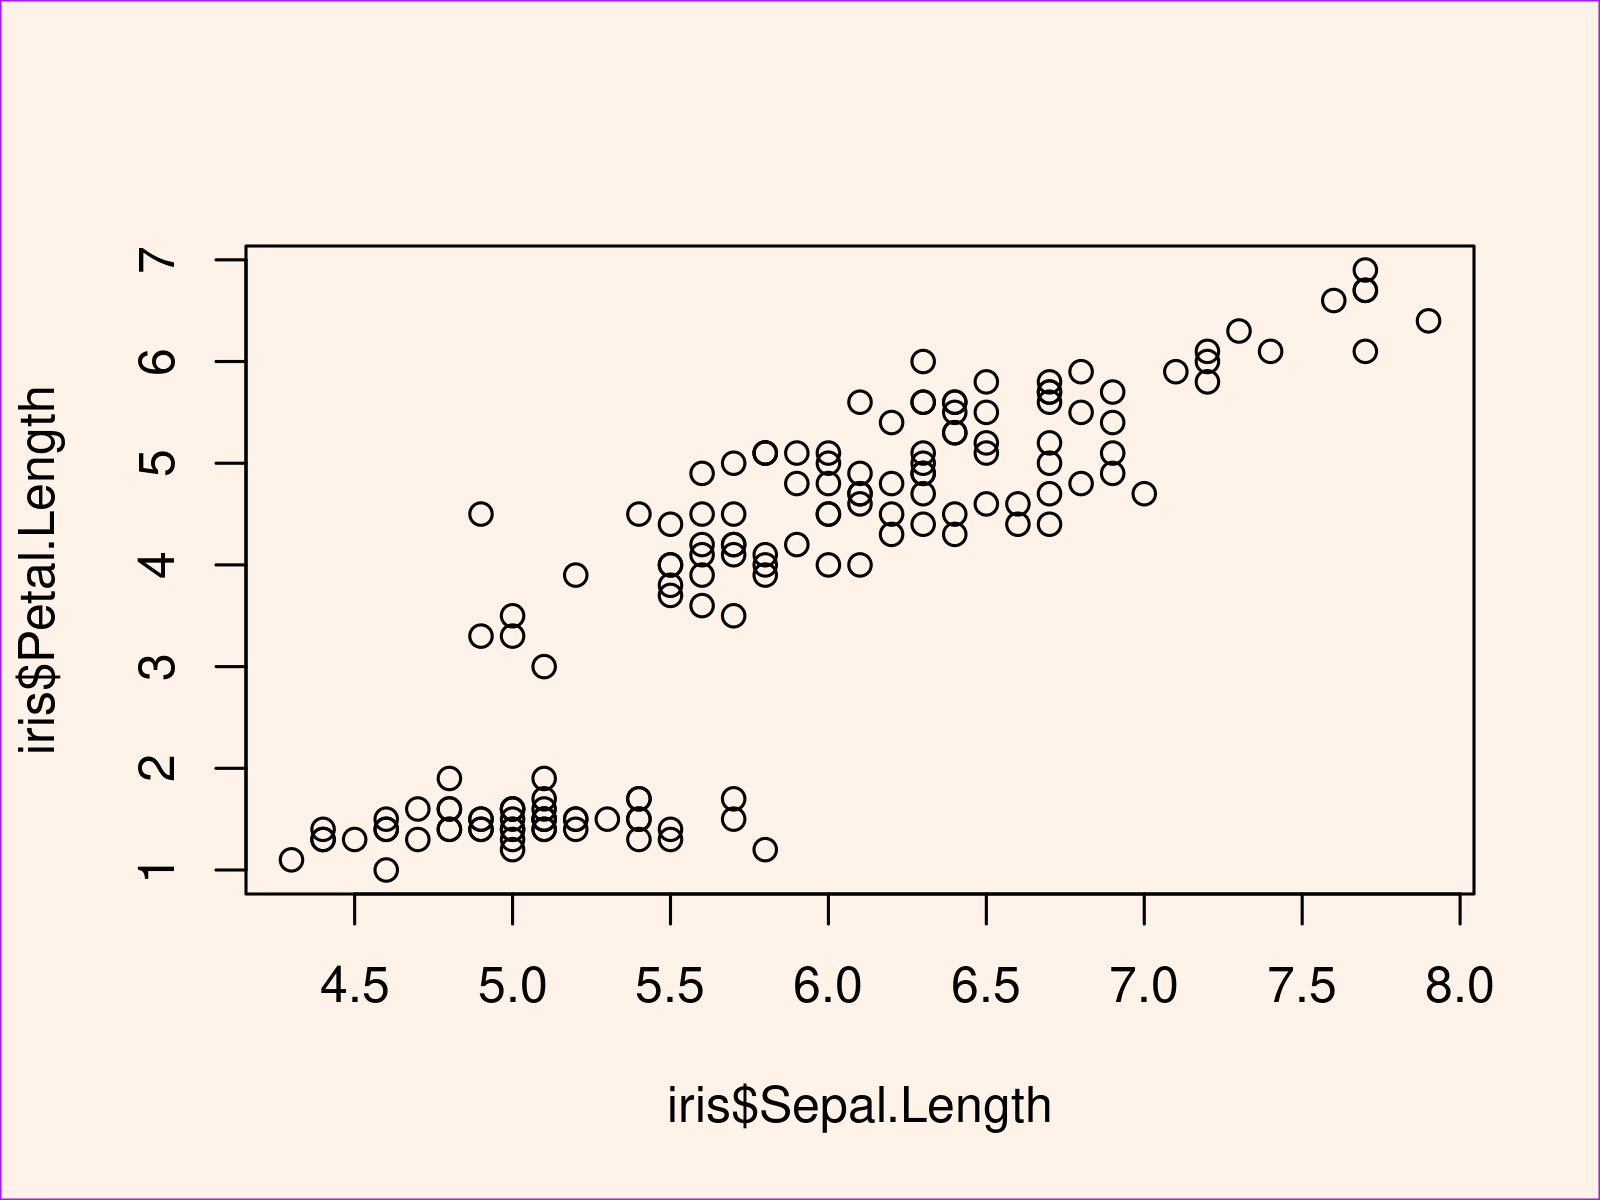
plot(x = iris$Sepal.Length, # Create plot without box y = iris$Petal.Length) box(col = "purple", # Adding a box around the entire figure which = "figure") |
plot(x = iris$Sepal.Length, # Create plot without box y = iris$Petal.Length) box(col = "purple", # Adding a box around the entire figure which = "figure")

