Add Text with Expressions to Plot in R (Example Code)
In this tutorial you’ll learn how to annotate a text with expressions to a plot in the R programming language.
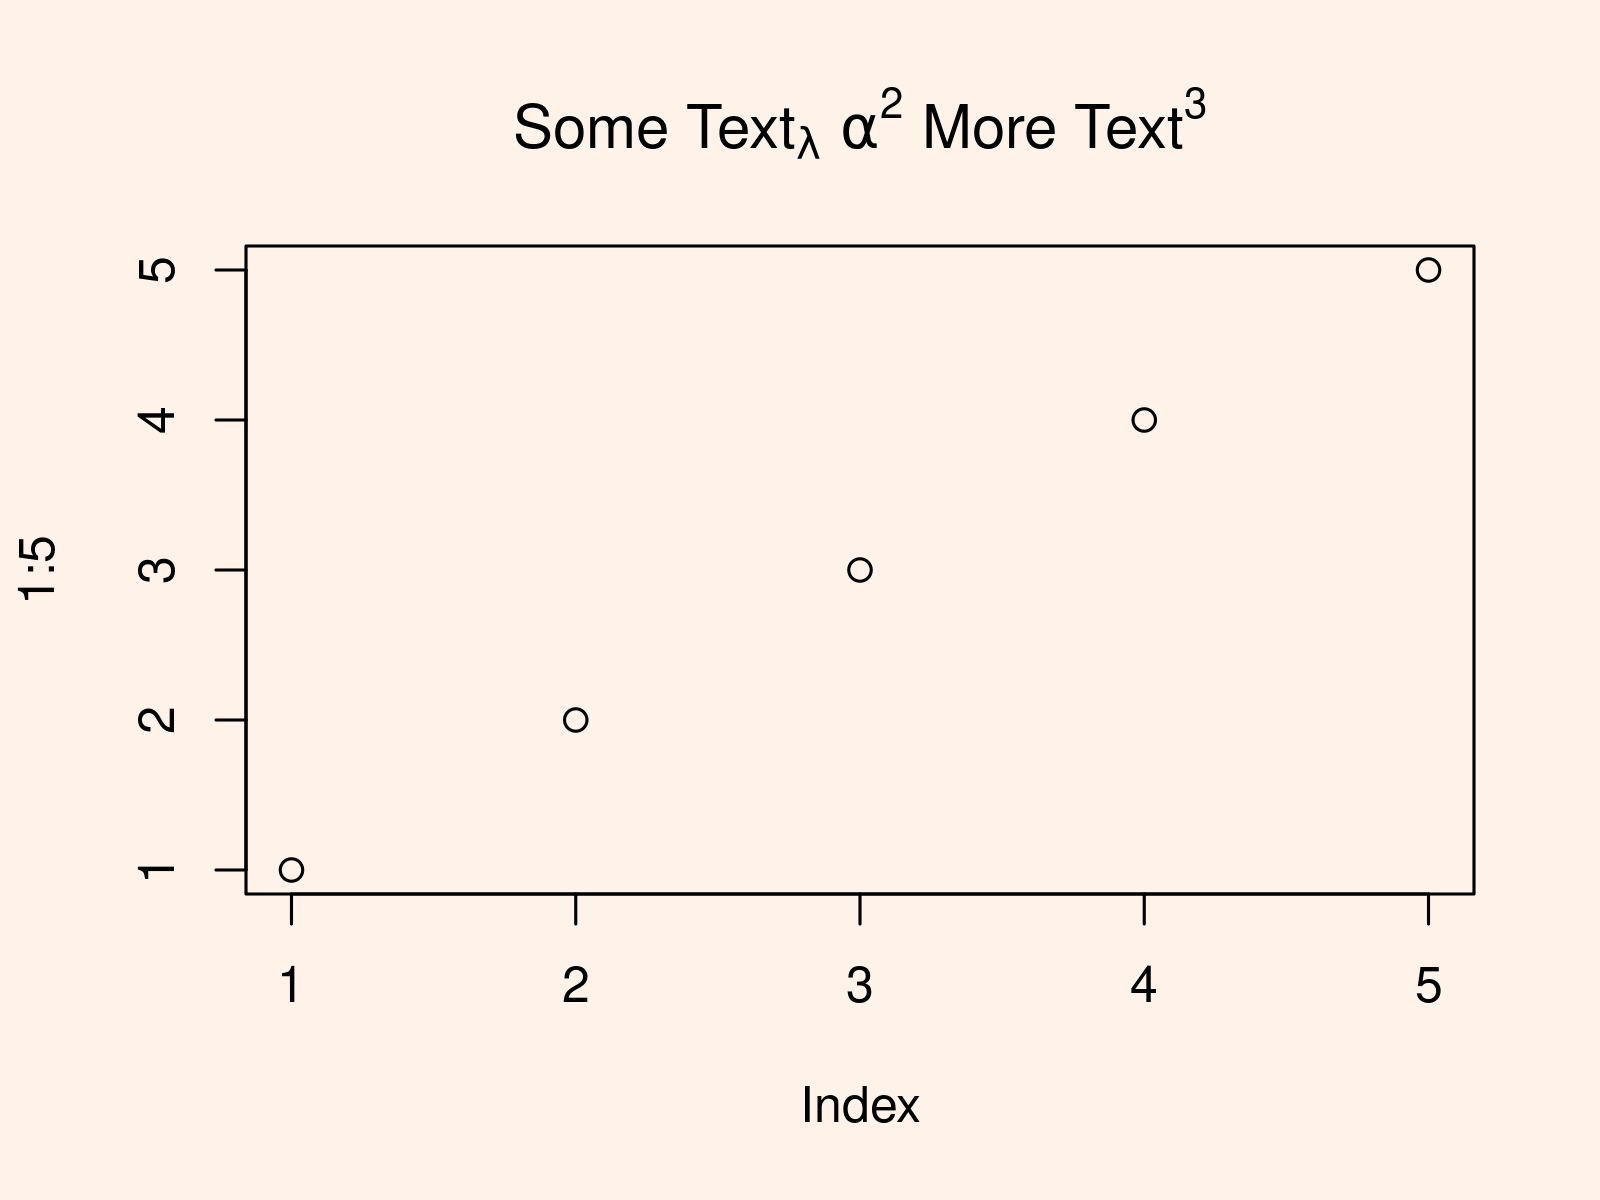
Example: Concatenating Character String & Expressions in Text of Graphic
plot(1:5, # Adding main title with expressions main = expression("Some Text"[lambda] ~ alpha ^ 2 ~ "More Text" ^ 3)) |
plot(1:5, # Adding main title with expressions main = expression("Some Text"[lambda] ~ alpha ^ 2 ~ "More Text" ^ 3))

Related Articles & Further Resources
Here, you may find some additional resources on topics such as extracting data, RStudio, and character strings.
