theme_dark() Function – Change ggplot2 Theme in R (4 Examples)
In this R article you’ll learn how to change the ggplot2 theme to the theme_dark.
Setting up the Examples
data(iris) # Load example data frame head(iris) # Display head of iris data frame # Sepal.Length Sepal.Width Petal.Length Petal.Width Species # 1 5.1 3.5 1.4 0.2 setosa # 2 4.9 3.0 1.4 0.2 setosa # 3 4.7 3.2 1.3 0.2 setosa # 4 4.6 3.1 1.5 0.2 setosa # 5 5.0 3.6 1.4 0.2 setosa # 6 5.4 3.9 1.7 0.4 setosa |
data(iris) # Load example data frame head(iris) # Display head of iris data frame # Sepal.Length Sepal.Width Petal.Length Petal.Width Species # 1 5.1 3.5 1.4 0.2 setosa # 2 4.9 3.0 1.4 0.2 setosa # 3 4.7 3.2 1.3 0.2 setosa # 4 4.6 3.1 1.5 0.2 setosa # 5 5.0 3.6 1.4 0.2 setosa # 6 5.4 3.9 1.7 0.4 setosa
install.packages("ggplot2") # Install ggplot2 package library("ggplot2") # Load ggplot2 package |
install.packages("ggplot2") # Install ggplot2 package library("ggplot2") # Load ggplot2 package
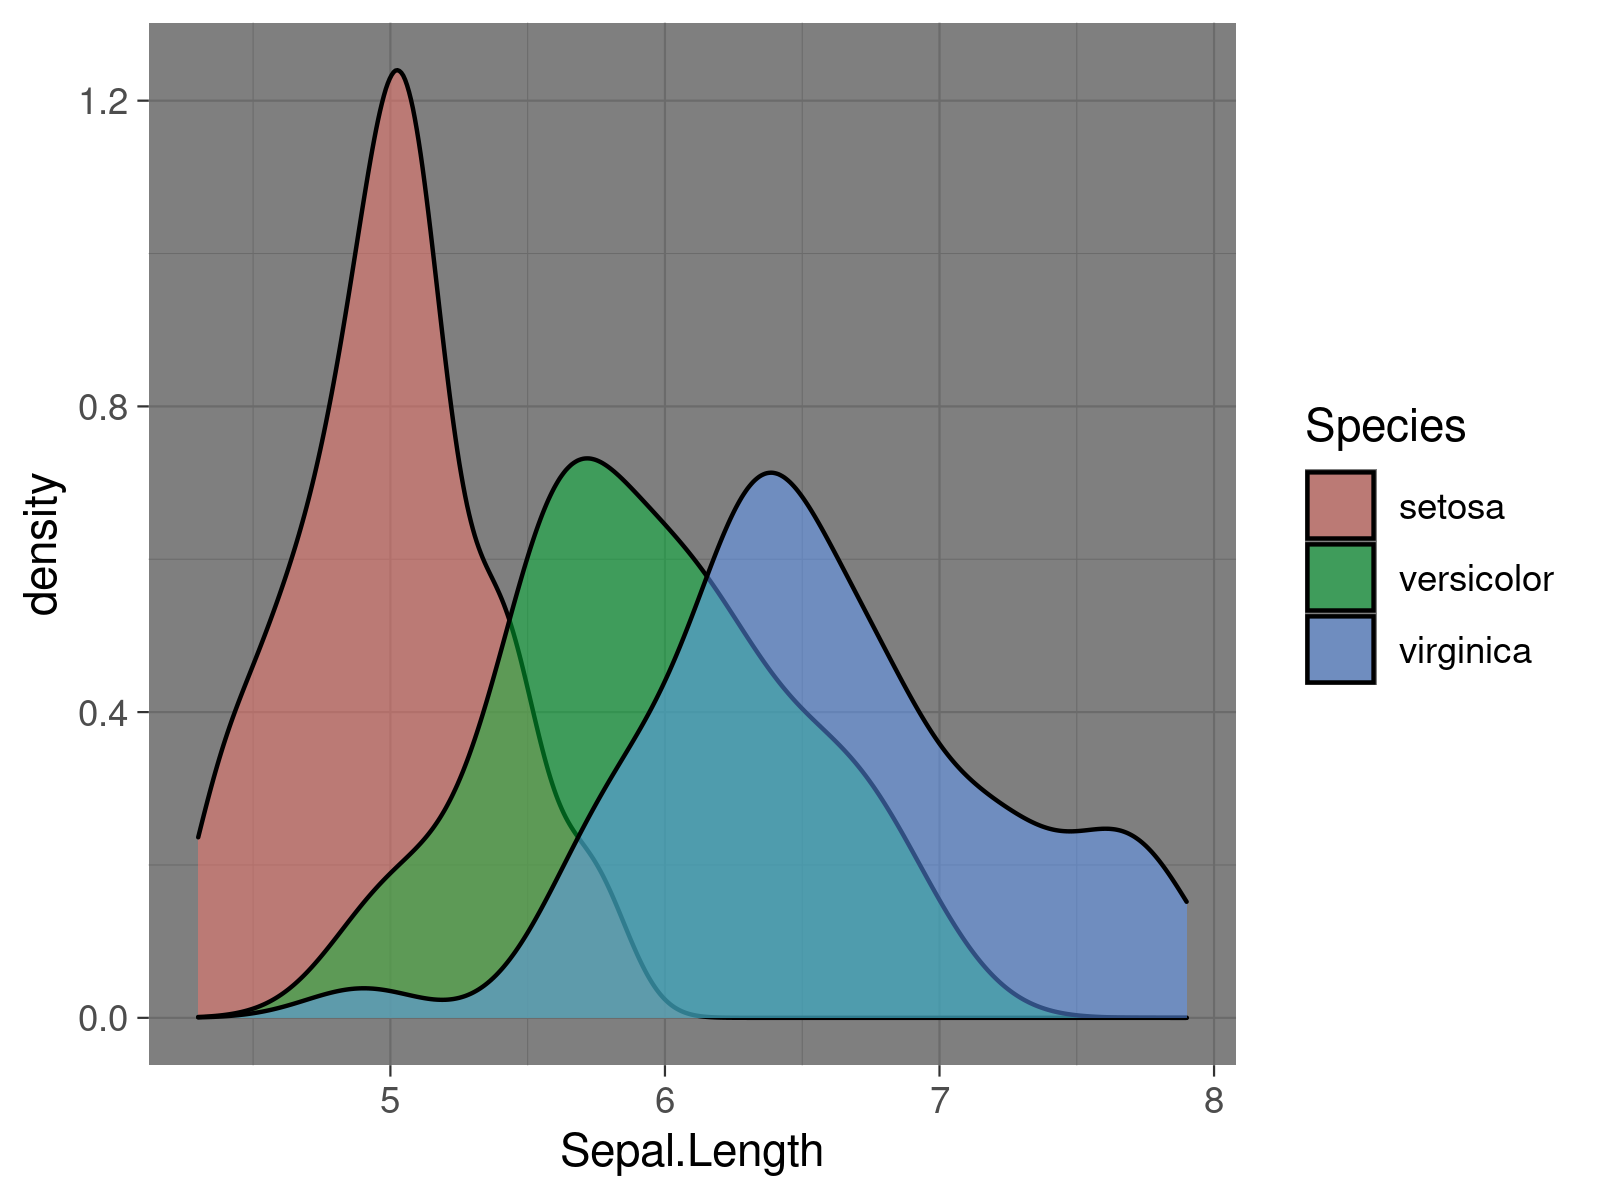
Example 1: Create ggplot2 Density Plot Using theme_dark() Function
ggplot(iris, # Apply theme_dark Function aes(x = Sepal.Length, fill = Species)) + geom_density(alpha = 0.5) + theme_dark() |
ggplot(iris, # Apply theme_dark Function aes(x = Sepal.Length, fill = Species)) + geom_density(alpha = 0.5) + theme_dark()

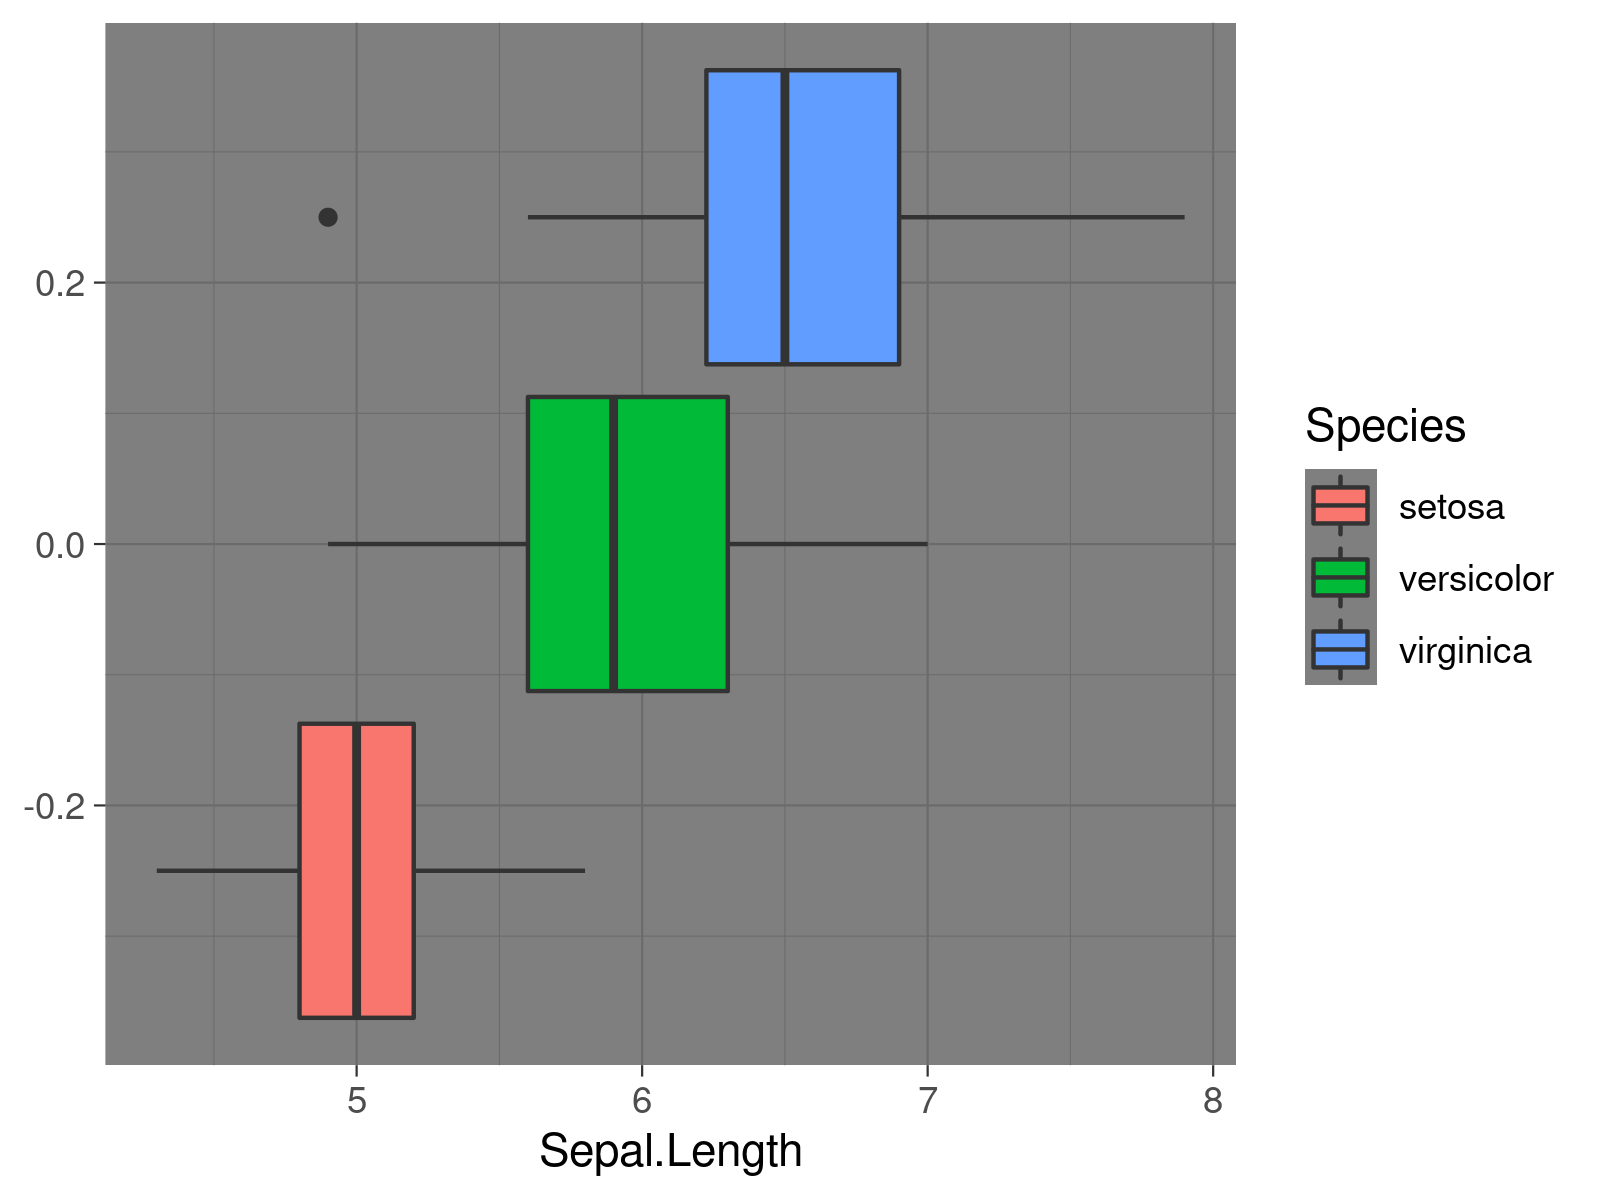
Example 2: Create ggplot2 Boxplot Using theme_dark() Function
ggplot(iris, # Apply theme_dark Function aes(x = Sepal.Length, fill = Species)) + geom_boxplot() + theme_dark() |
ggplot(iris, # Apply theme_dark Function aes(x = Sepal.Length, fill = Species)) + geom_boxplot() + theme_dark()

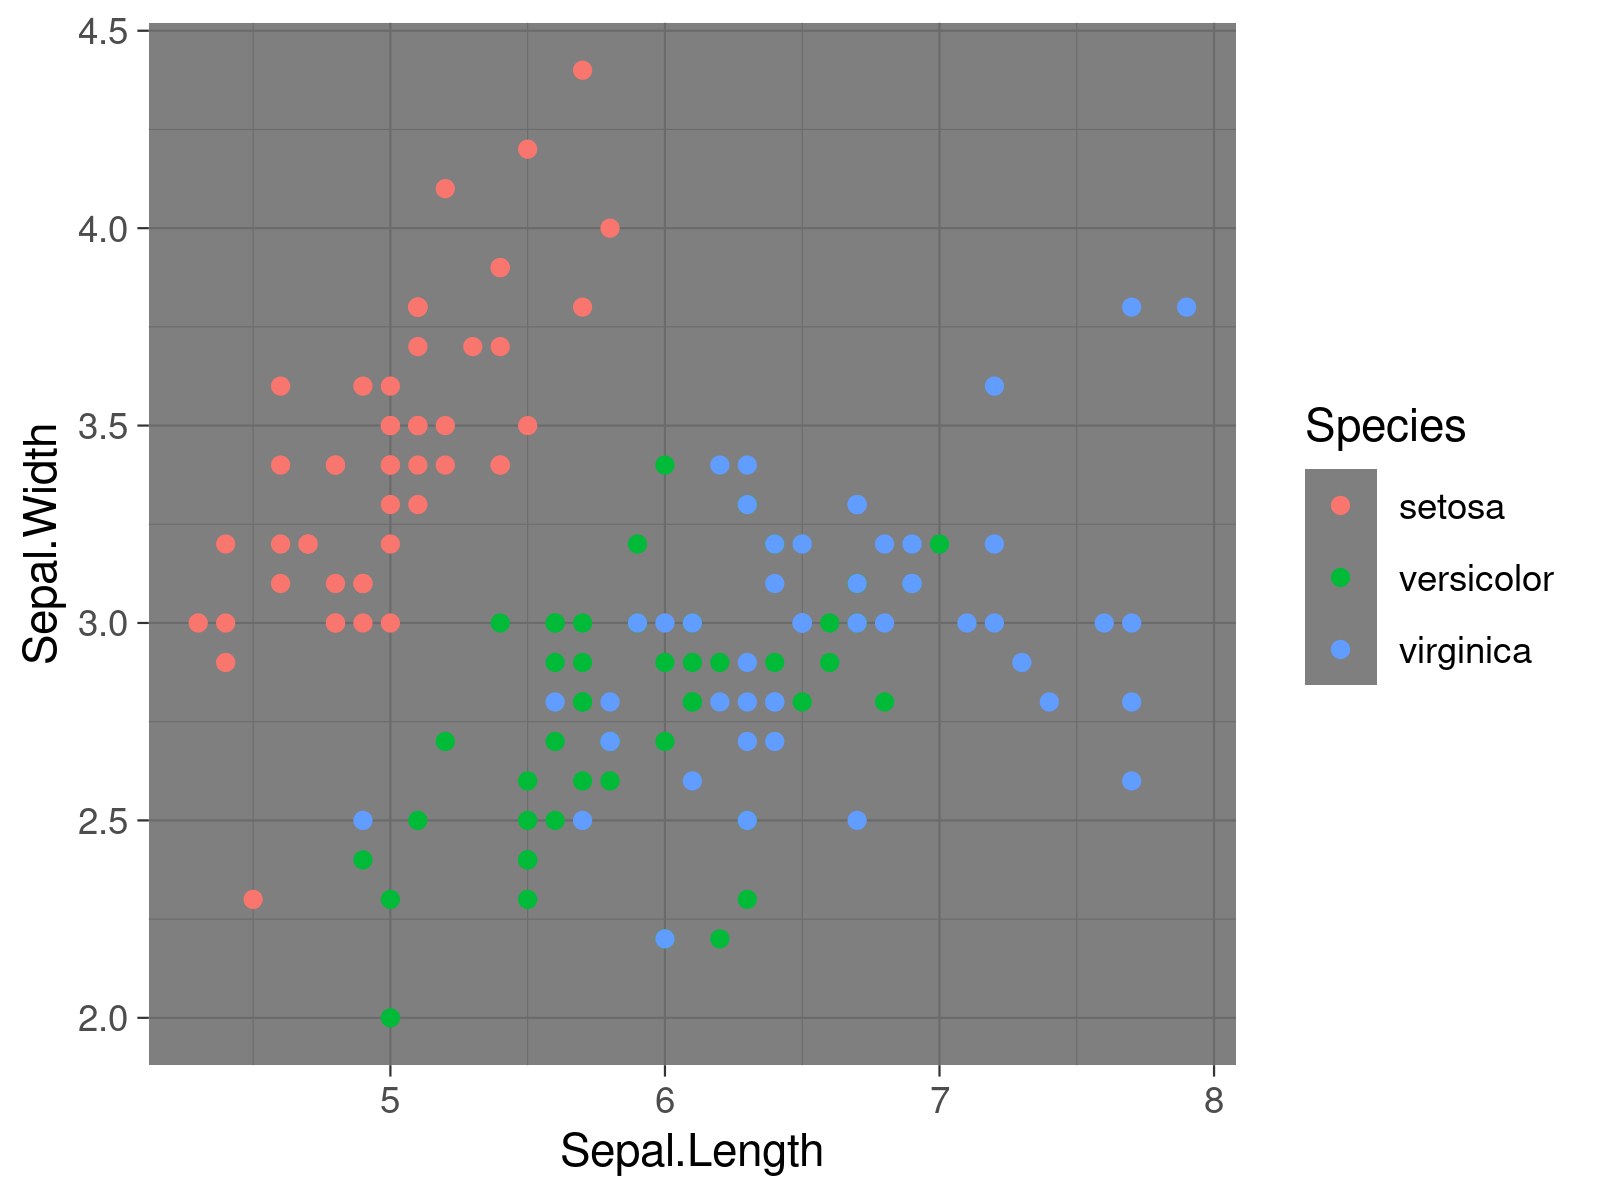
Example 3: Create ggplot2 Scatterplot Using theme_dark() Function
ggplot(iris, # Apply theme_dark Function aes(x = Sepal.Length, y = Sepal.Width, col = Species)) + geom_point() + theme_dark() |
ggplot(iris, # Apply theme_dark Function aes(x = Sepal.Length, y = Sepal.Width, col = Species)) + geom_point() + theme_dark()

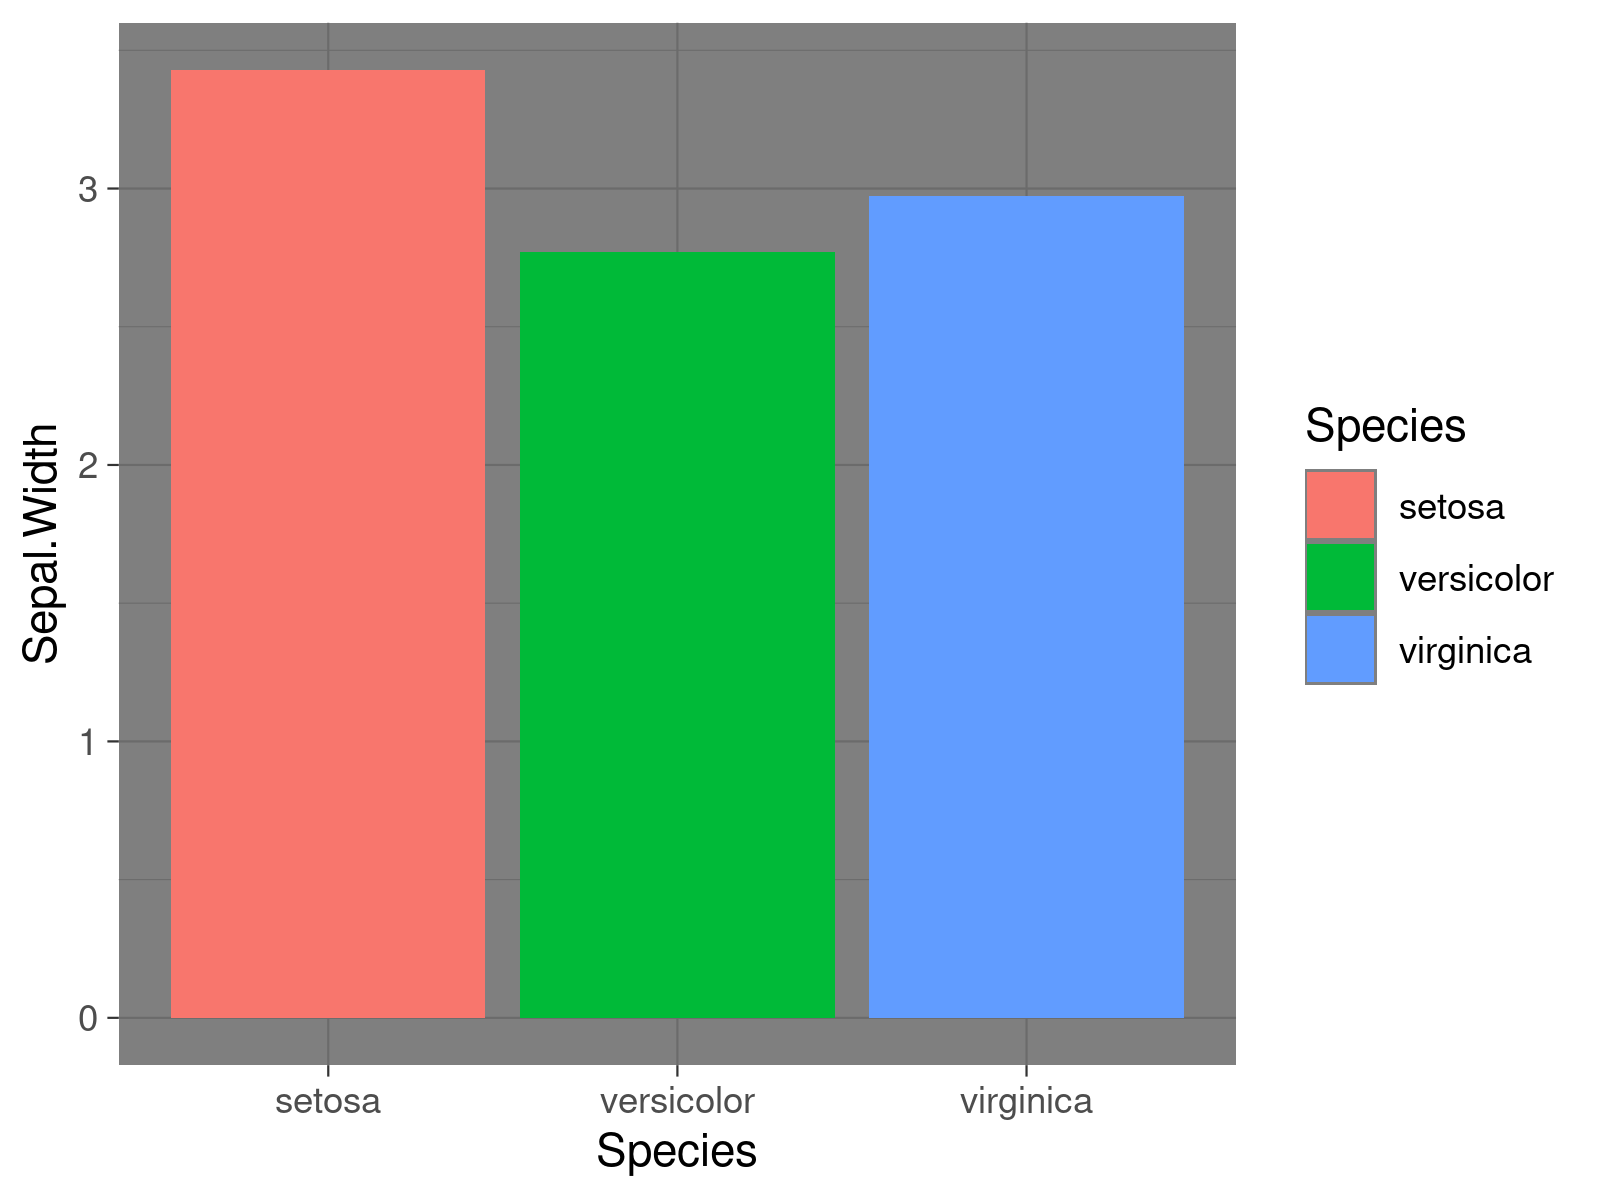
Example 4: Create ggplot2 Barchart Using theme_dark() Function
ggplot(aggregate(Sepal.Width ~ Species, iris, mean), # Apply theme_dark Function aes(x = Species, y = Sepal.Width, fill = Species)) + geom_bar(stat = "identity") + theme_dark() |
ggplot(aggregate(Sepal.Width ~ Species, iris, mean), # Apply theme_dark Function aes(x = Species, y = Sepal.Width, fill = Species)) + geom_bar(stat = "identity") + theme_dark()

