How to Set Origin of Plot Axes to Zero in R (Example Code)
In this tutorial you’ll learn how to set the start of x- and y-axes to zero in the R programming language.
Example: Set Plot Axes to Start at 0
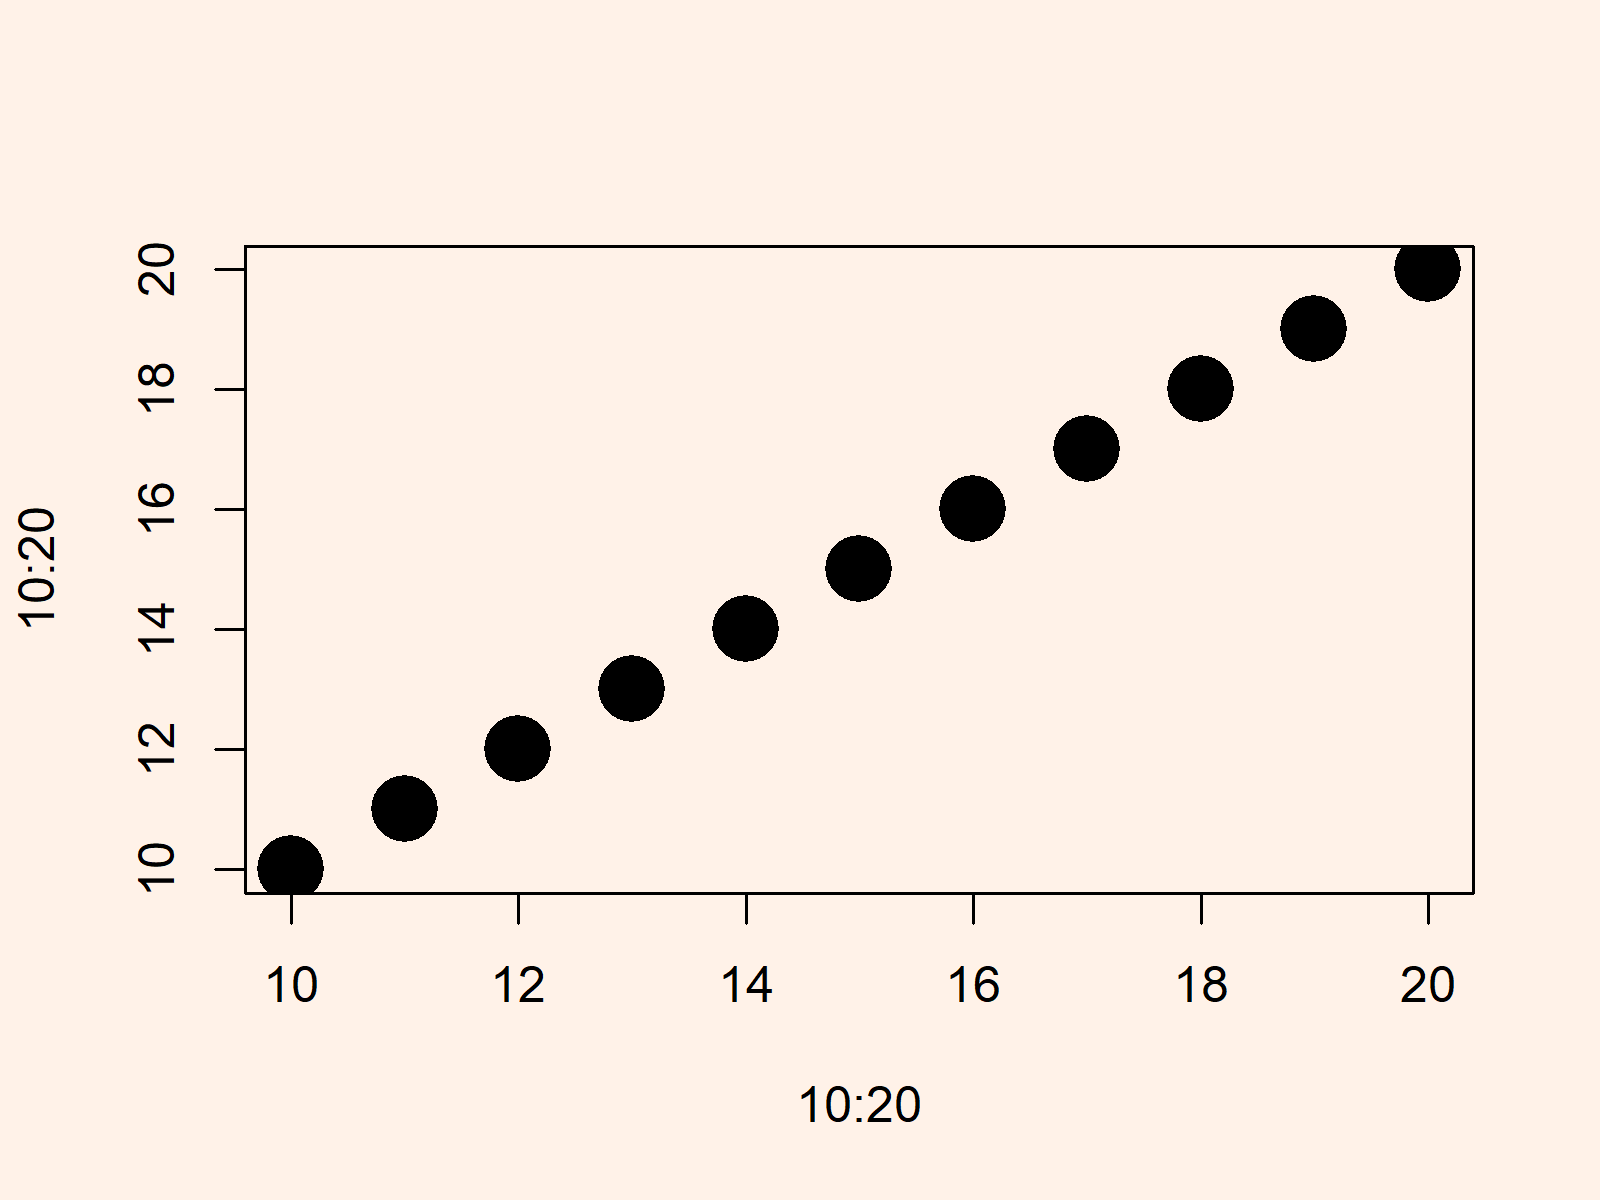
plot(10:20, 10:20, # Create plot with default axes pch = 16, cex = 3) |
plot(10:20, 10:20, # Create plot with default axes pch = 16, cex = 3)

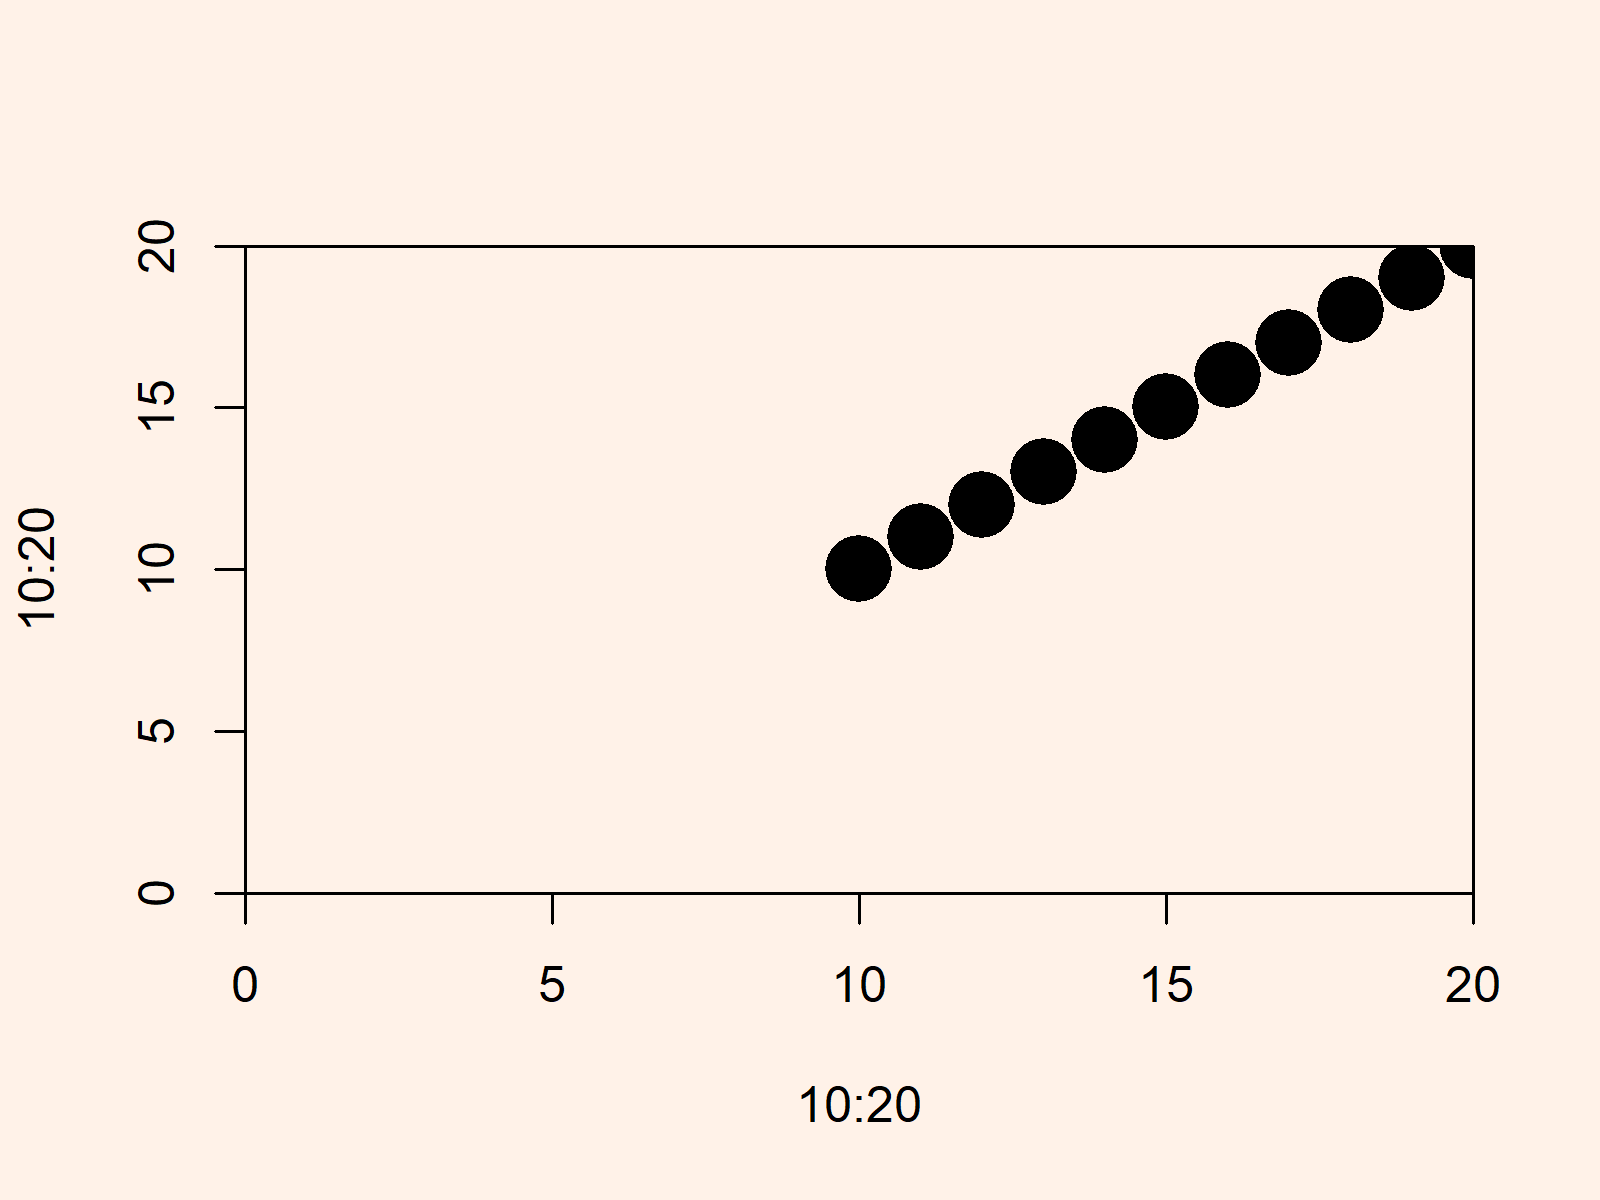
plot(10:20, 10:20, # Force origin of axes to start at zero pch = 16, cex = 3, xlim = c(0, 20), ylim = c(0, 20), xaxs = "i", yaxs = "i") |
plot(10:20, 10:20, # Force origin of axes to start at zero pch = 16, cex = 3, xlim = c(0, 20), ylim = c(0, 20), xaxs = "i", yaxs = "i")

Related Articles & Further Resources
Have a look at the following R programming tutorials. They focus on topics such as ggplot2 and graphics in R:
