R How to Show the Y-Axis of a ggplot2 Barplot in Percentage Points (Example Code)
This tutorial illustrates how to set the axis labels of a barchart in percentage points in the R programming language.
Preparing the Example
my_df <- data.frame(labels = c("L1", "L2", "L3"), # Example data percentages = c(0.8, 0.4, 0.5)) my_df # Print data # labels percentages # 1 L1 0.8 # 2 L2 0.4 # 3 L3 0.5 |
install.packages("ggplot2") # Install ggplot2 package library("ggplot2") # Load ggplot2 |
my_plot <- ggplot(my_df, aes(x = labels, y = percentages)) + # Create ggplot2 plot geom_bar(stat = "identity") my_plot # Draw ggplot2 plot |

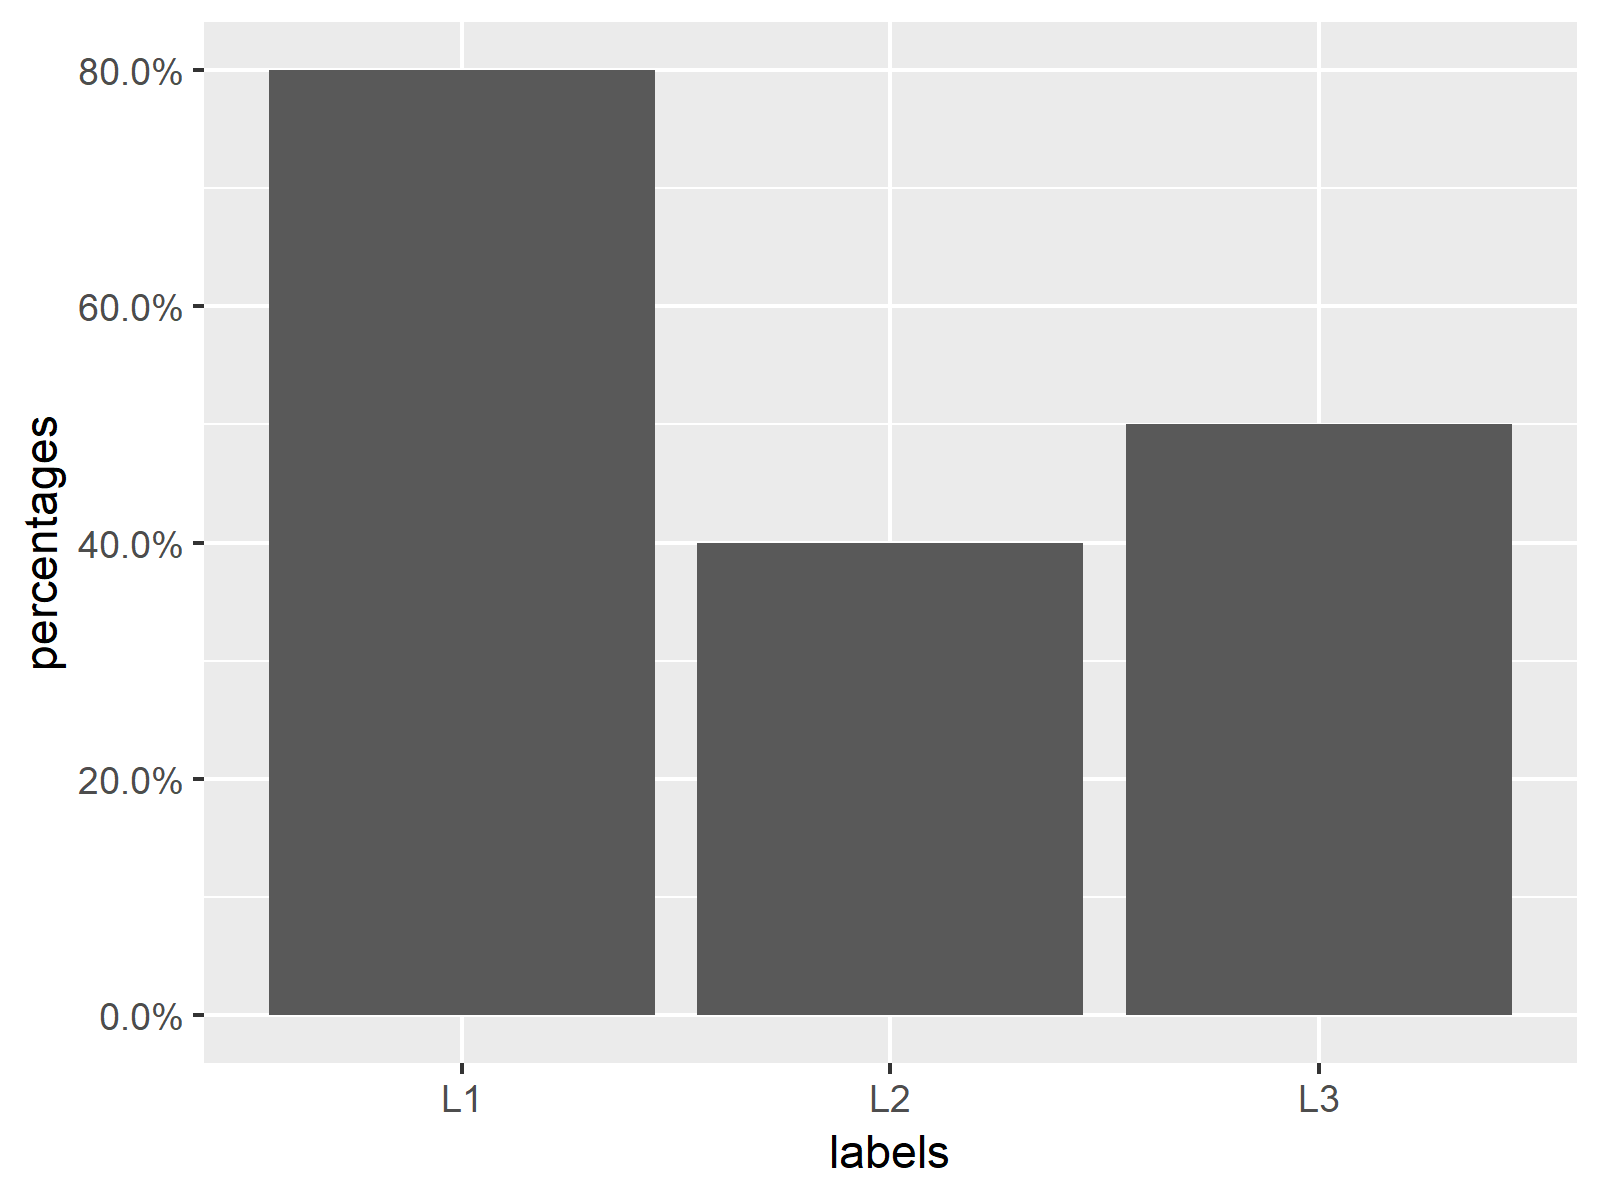
Example: Modifying Y-Axis as Percentage
my_plot + # Changing y-axis to percentage points scale_y_continuous(labels = scales::percent) |