R How to Left-Align Text in a ggplot2 Graph with annotate & hjust (Example Code)
In this tutorial you’ll learn how to allign text in a ggplot2 graphic on the left side of the plot in R programming.
Setting up the Example
my_df <- data.frame(x = 1:100, # My data y = 1:100) |
my_df <- data.frame(x = 1:100, # My data y = 1:100)
install.packages("ggplot2") # Install & load ggplot2 package library("ggplot2") |
install.packages("ggplot2") # Install & load ggplot2 package library("ggplot2")
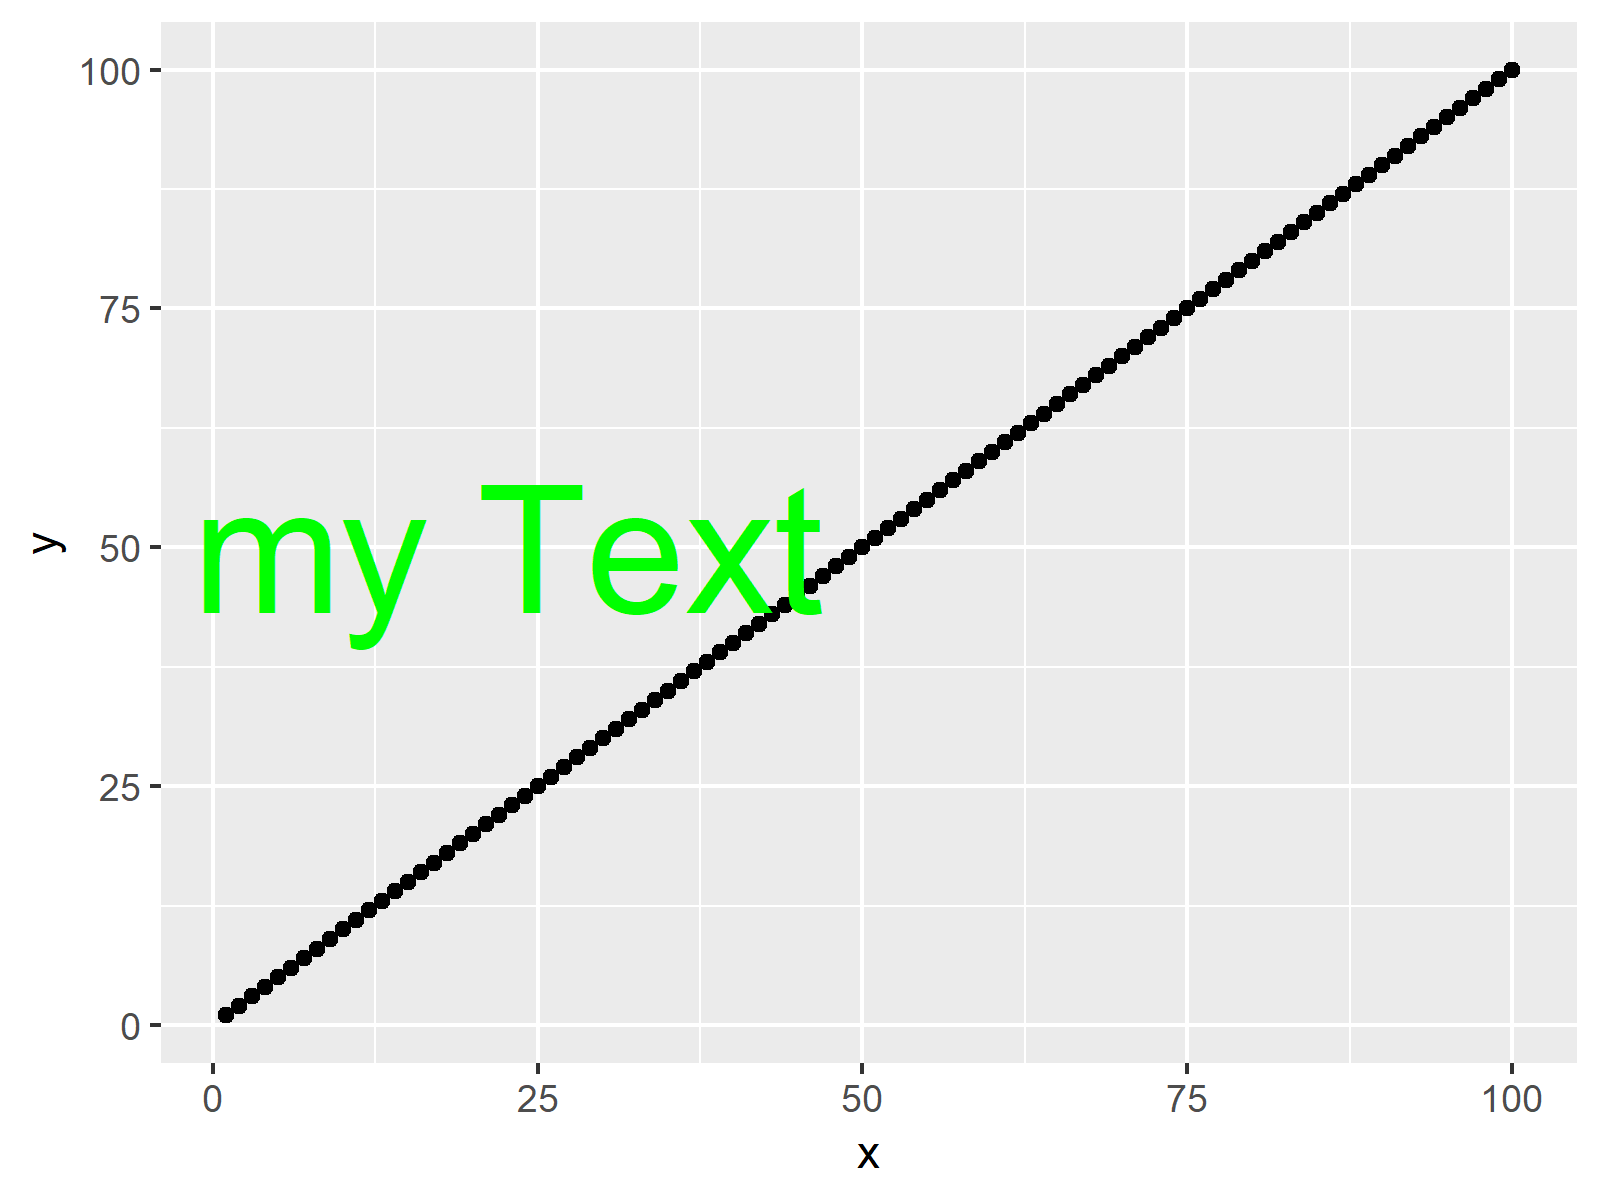
ggplot(my_df, aes(x, y)) + # ggplot2 plot with text geom_point() + annotate(geom = "text", x = 1, y = 50, label = "This is my Text", col = "green", size = 15) |
ggplot(my_df, aes(x, y)) + # ggplot2 plot with text geom_point() + annotate(geom = "text", x = 1, y = 50, label = "This is my Text", col = "green", size = 15)

Example: Adding Left-Alligned Text to the Graph
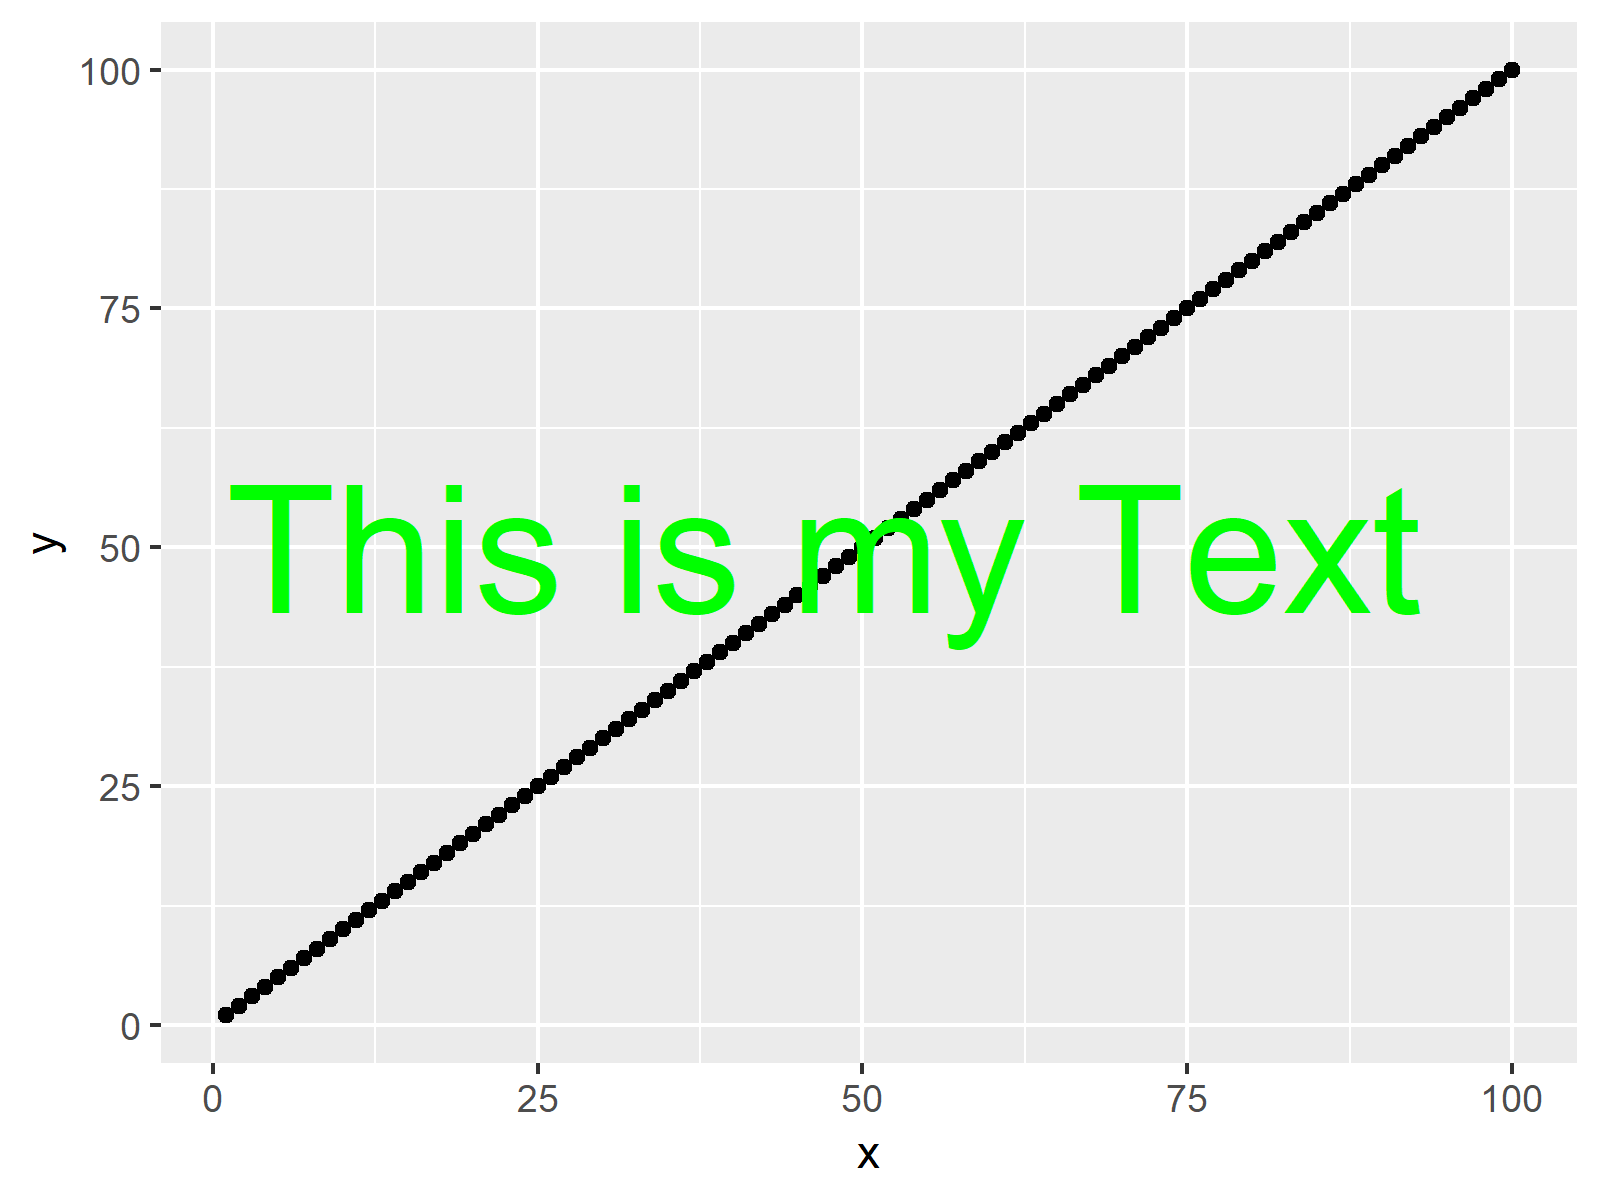
ggplot(my_df, aes(x, y)) + # ggplot2 plot with left-alligned text geom_point() + annotate(geom = "text", x = 1, y = 50, label = "This is my Text", col = "green", size = 15, hjust = 0) # The hjust argument left-alligns our text |
ggplot(my_df, aes(x, y)) + # ggplot2 plot with left-alligned text geom_point() + annotate(geom = "text", x = 1, y = 50, label = "This is my Text", col = "green", size = 15, hjust = 0) # The hjust argument left-alligns our text

