Pairs Plot in R (2 Examples)
This page shows how to draw a pairs plot in the R programming language.
Example 1: Square Polygon
Example data:
set.seed(765) # Set seed my_data <- data.frame(x = rnorm(1000), # Create example data y = rnorm(1000), z = rnorm(1000)) |
Basic application of pairs function:
pairs(my_data) # Basic pairs plot in R |

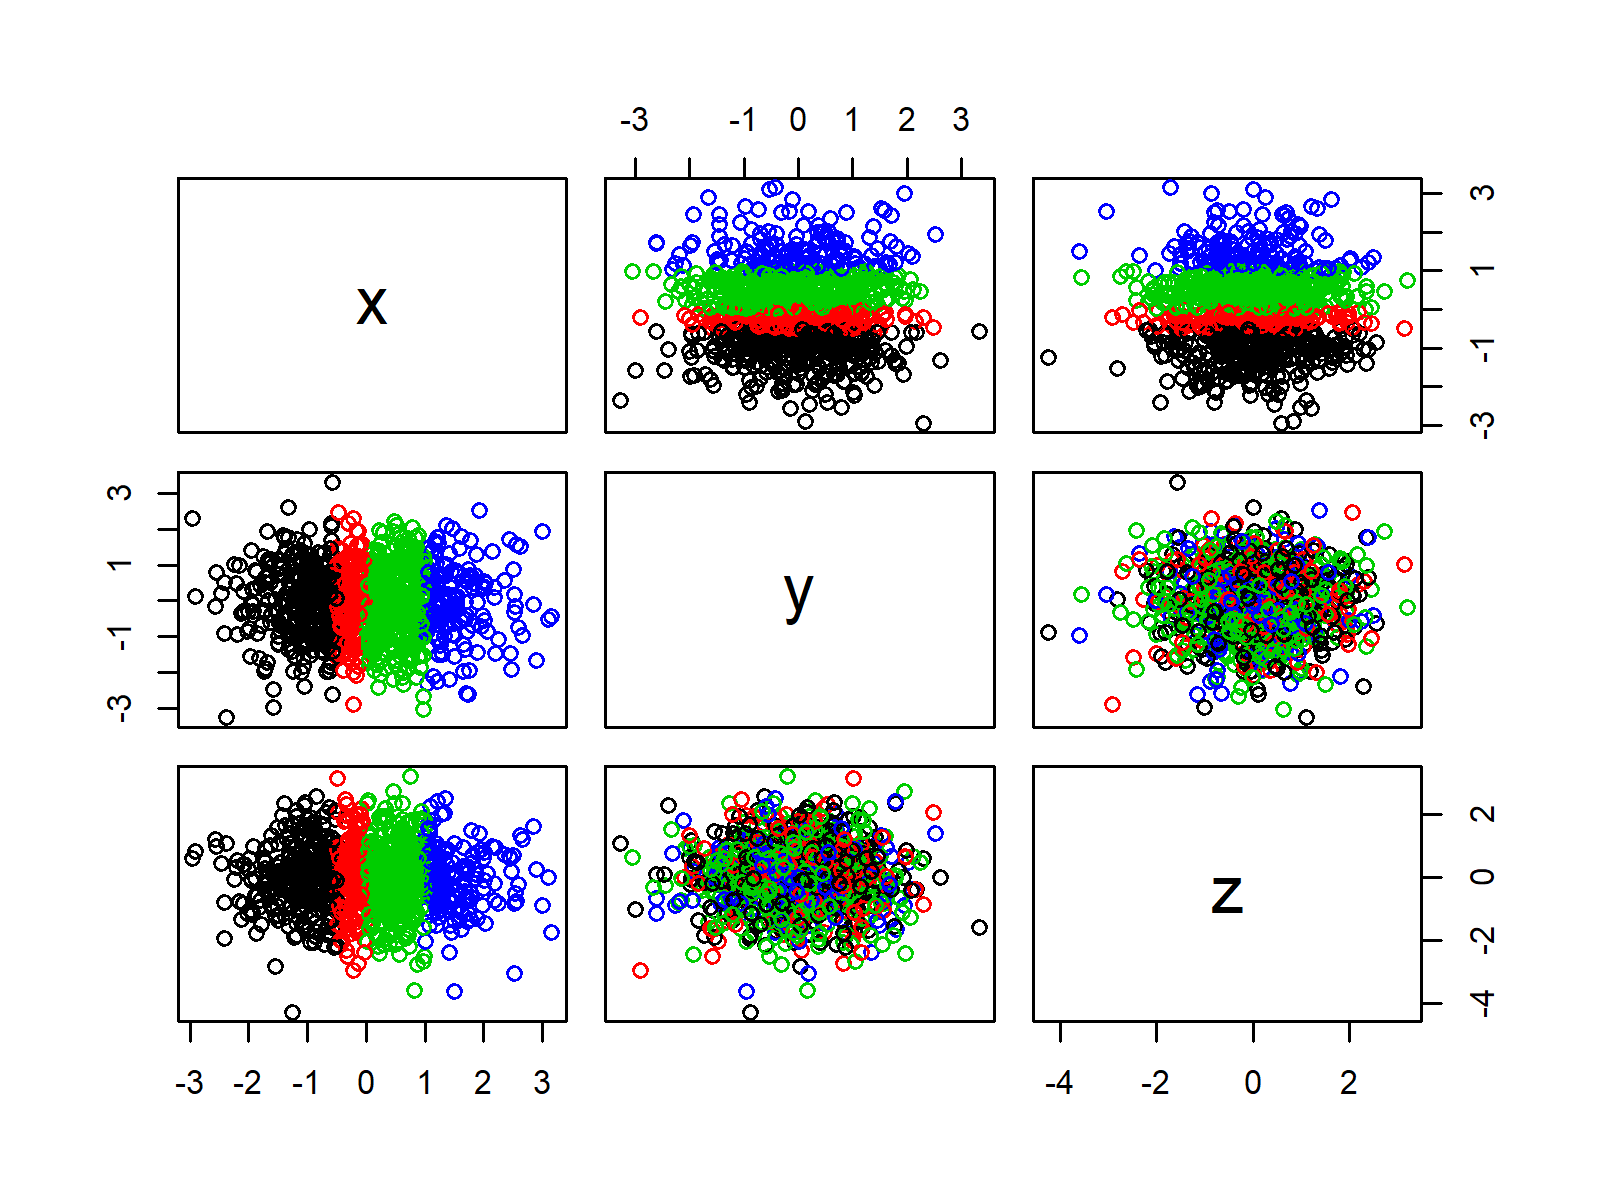
Example 2: Density Polygon
Adding group variable to example data:
my_data$group <- NA # Create group variable my_data$group[my_data$x < -0.5] <- 1 my_data$group[my_data$x >= -0.5 & my_data$x < 0] <- 2 my_data$group[my_data$x >= 0 & my_data$x < 1] <- 3 my_data$group[my_data$x > 1] <- 4 my_data$group <- as.factor(my_data$group) |
Pairs plot with colors by group:
pairs(my_data[ , 1:3], col = my_data$group) # Pairs plot color by group |