R Draw Frequencies & Percentages on Top of Histogram Bars (2 Examples)
In this R programming post you’ll learn how to show counts and percentages in histograms.
Exemplifying Data
data(iris) # Example data head(iris) # Sepal.Length Sepal.Width Petal.Length Petal.Width Species # 1 5.1 3.5 1.4 0.2 setosa # 2 4.9 3.0 1.4 0.2 setosa # 3 4.7 3.2 1.3 0.2 setosa # 4 4.6 3.1 1.5 0.2 setosa # 5 5.0 3.6 1.4 0.2 setosa # 6 5.4 3.9 1.7 0.4 setosa |
data(iris) # Example data head(iris) # Sepal.Length Sepal.Width Petal.Length Petal.Width Species # 1 5.1 3.5 1.4 0.2 setosa # 2 4.9 3.0 1.4 0.2 setosa # 3 4.7 3.2 1.3 0.2 setosa # 4 4.6 3.1 1.5 0.2 setosa # 5 5.0 3.6 1.4 0.2 setosa # 6 5.4 3.9 1.7 0.4 setosa
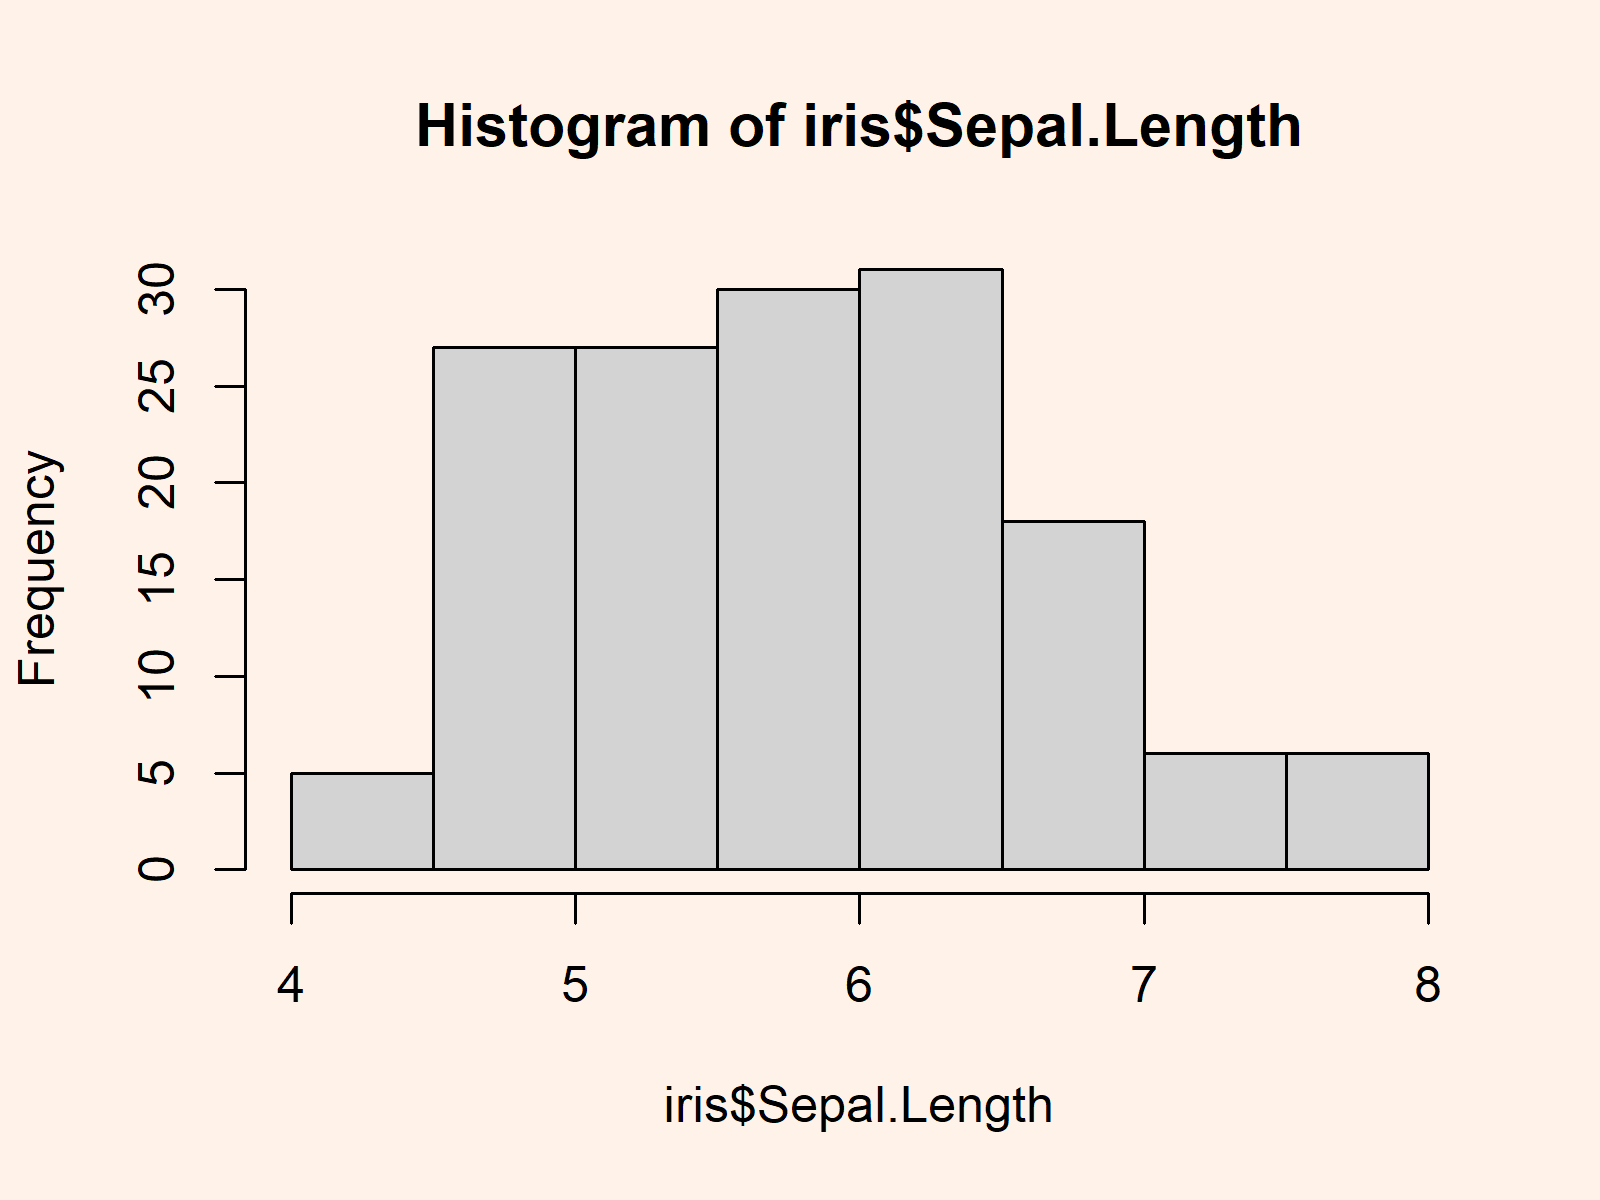
hist(iris$Sepal.Length) # Histogram without labels |
hist(iris$Sepal.Length) # Histogram without labels

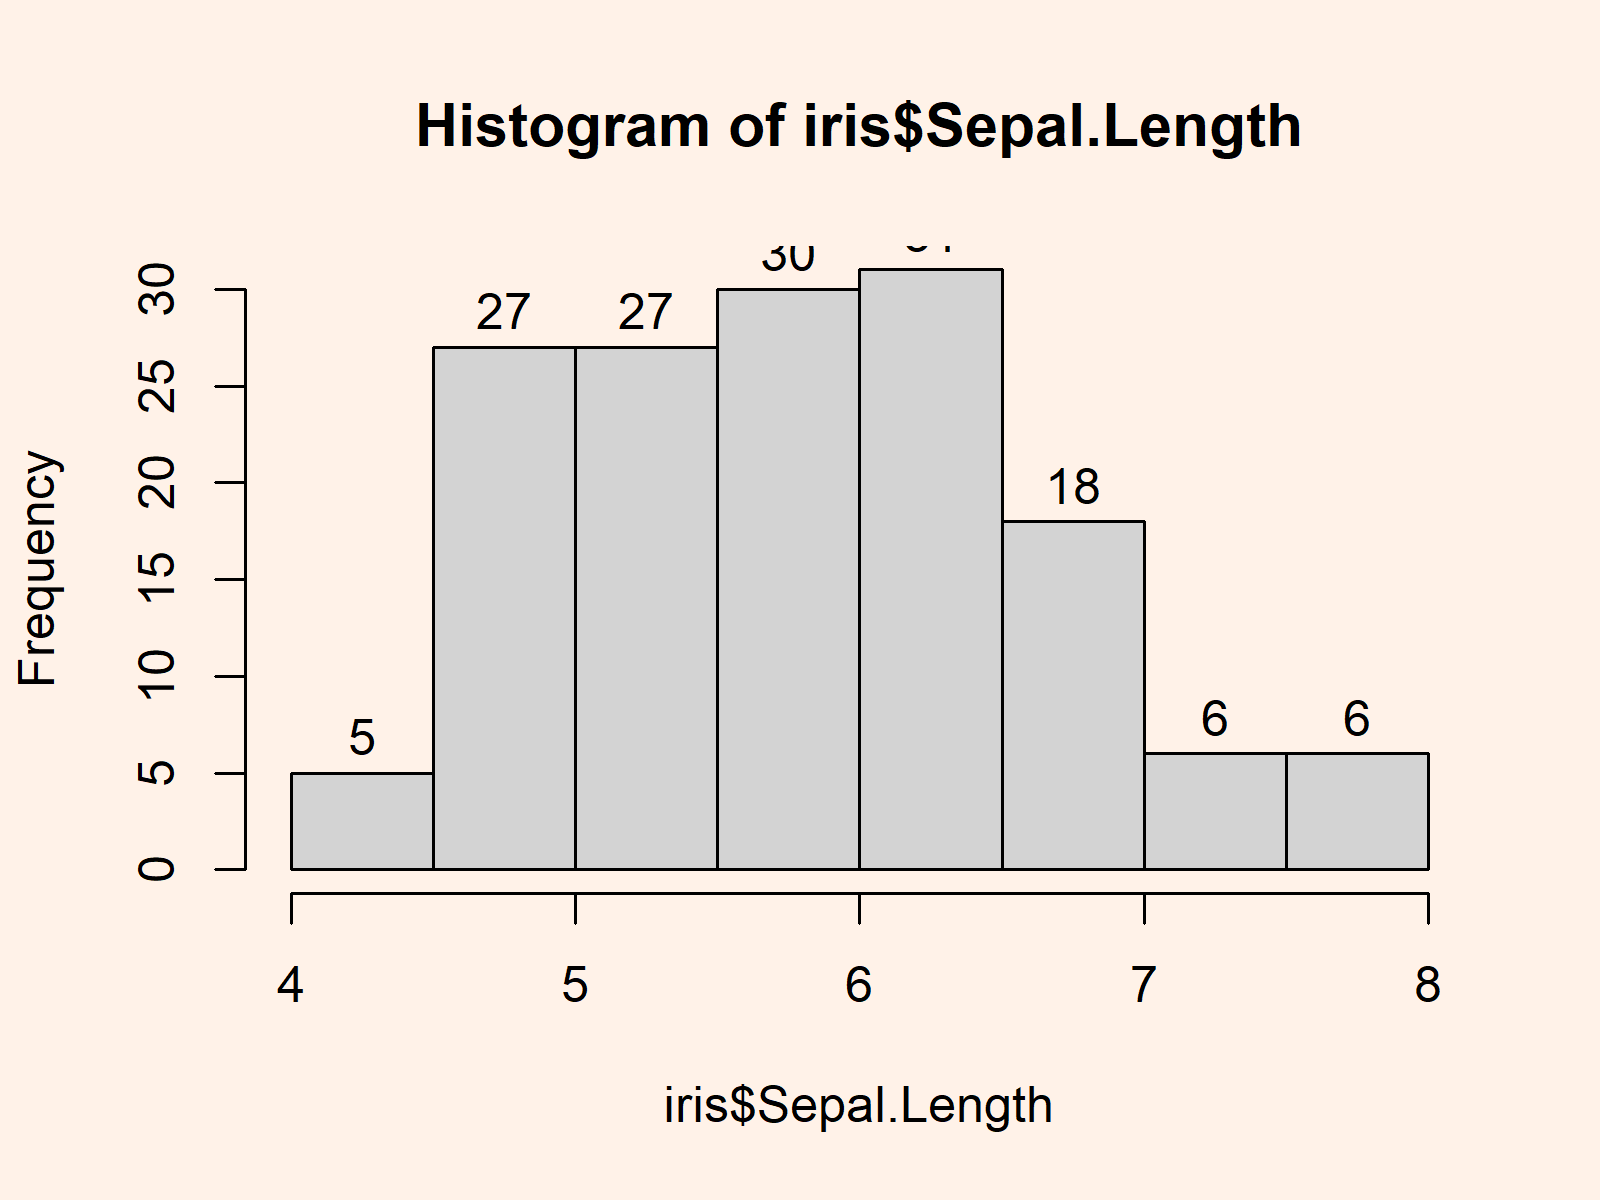
Example 1: Display Frequencies Above Histogram Bars
hist(iris$Sepal.Length, # Histogram with frequency labels labels = TRUE) |
hist(iris$Sepal.Length, # Histogram with frequency labels labels = TRUE)

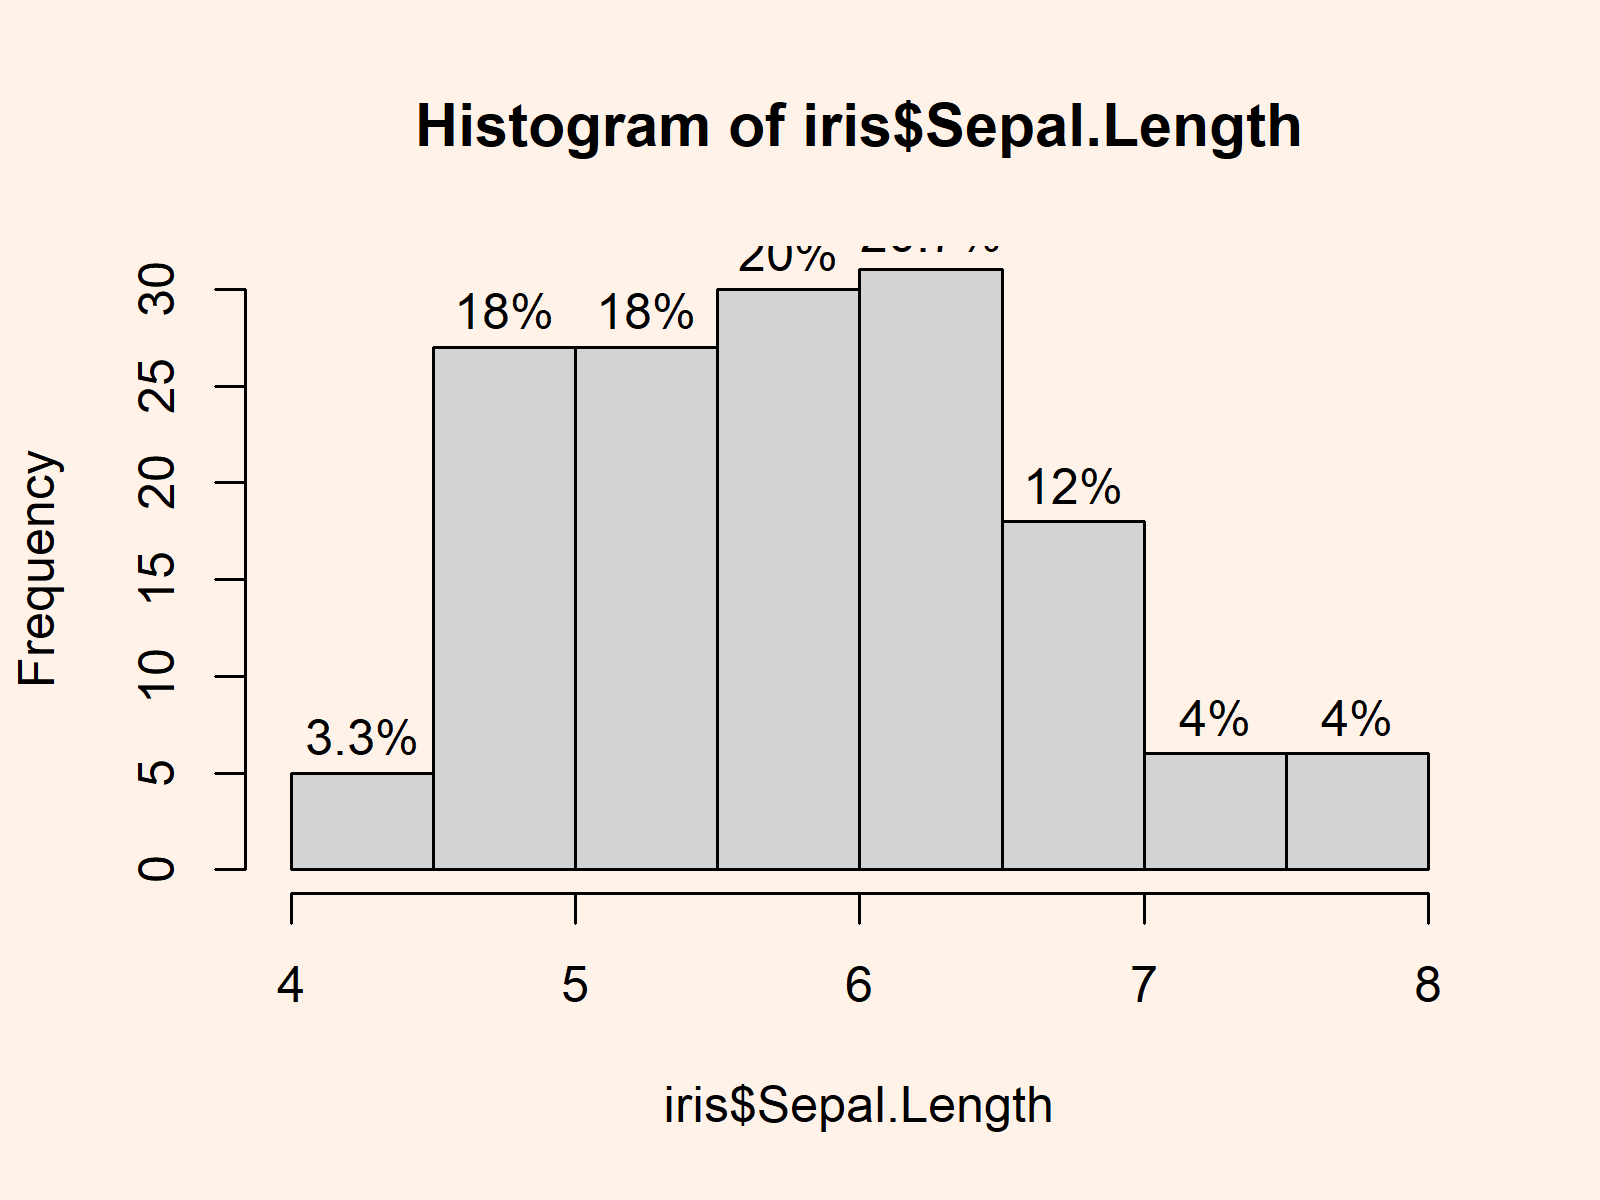
Example 2: Display Percentages Above Histogram Bars
hist(iris$Sepal.Length, # Histogram with percentage labels labels = paste0(hist(iris$Sepal.Length, plot = FALSE)$counts, "%")) |
hist(iris$Sepal.Length, # Histogram with percentage labels labels = paste0(hist(iris$Sepal.Length, plot = FALSE)$counts, "%"))

