Delete Legend from ggplot2 Plot in R (Example)
This R code shows how to remove the legend of a ggplot2 plot in the R programming language.
Example Data
my_data <- data.frame(x = 1:10, # Create example data y = 1:10, my_legend = c(rep("A", 5), rep("B", 5))) |
my_data <- data.frame(x = 1:10, # Create example data y = 1:10, my_legend = c(rep("A", 5), rep("B", 5)))
Load ggplot2 Package & Create Plot with Legend
Loading ggplot2:
install.packages("ggplot2") # Install ggplot2 package library("ggplot2") # Load ggplot2 package |
install.packages("ggplot2") # Install ggplot2 package library("ggplot2") # Load ggplot2 package
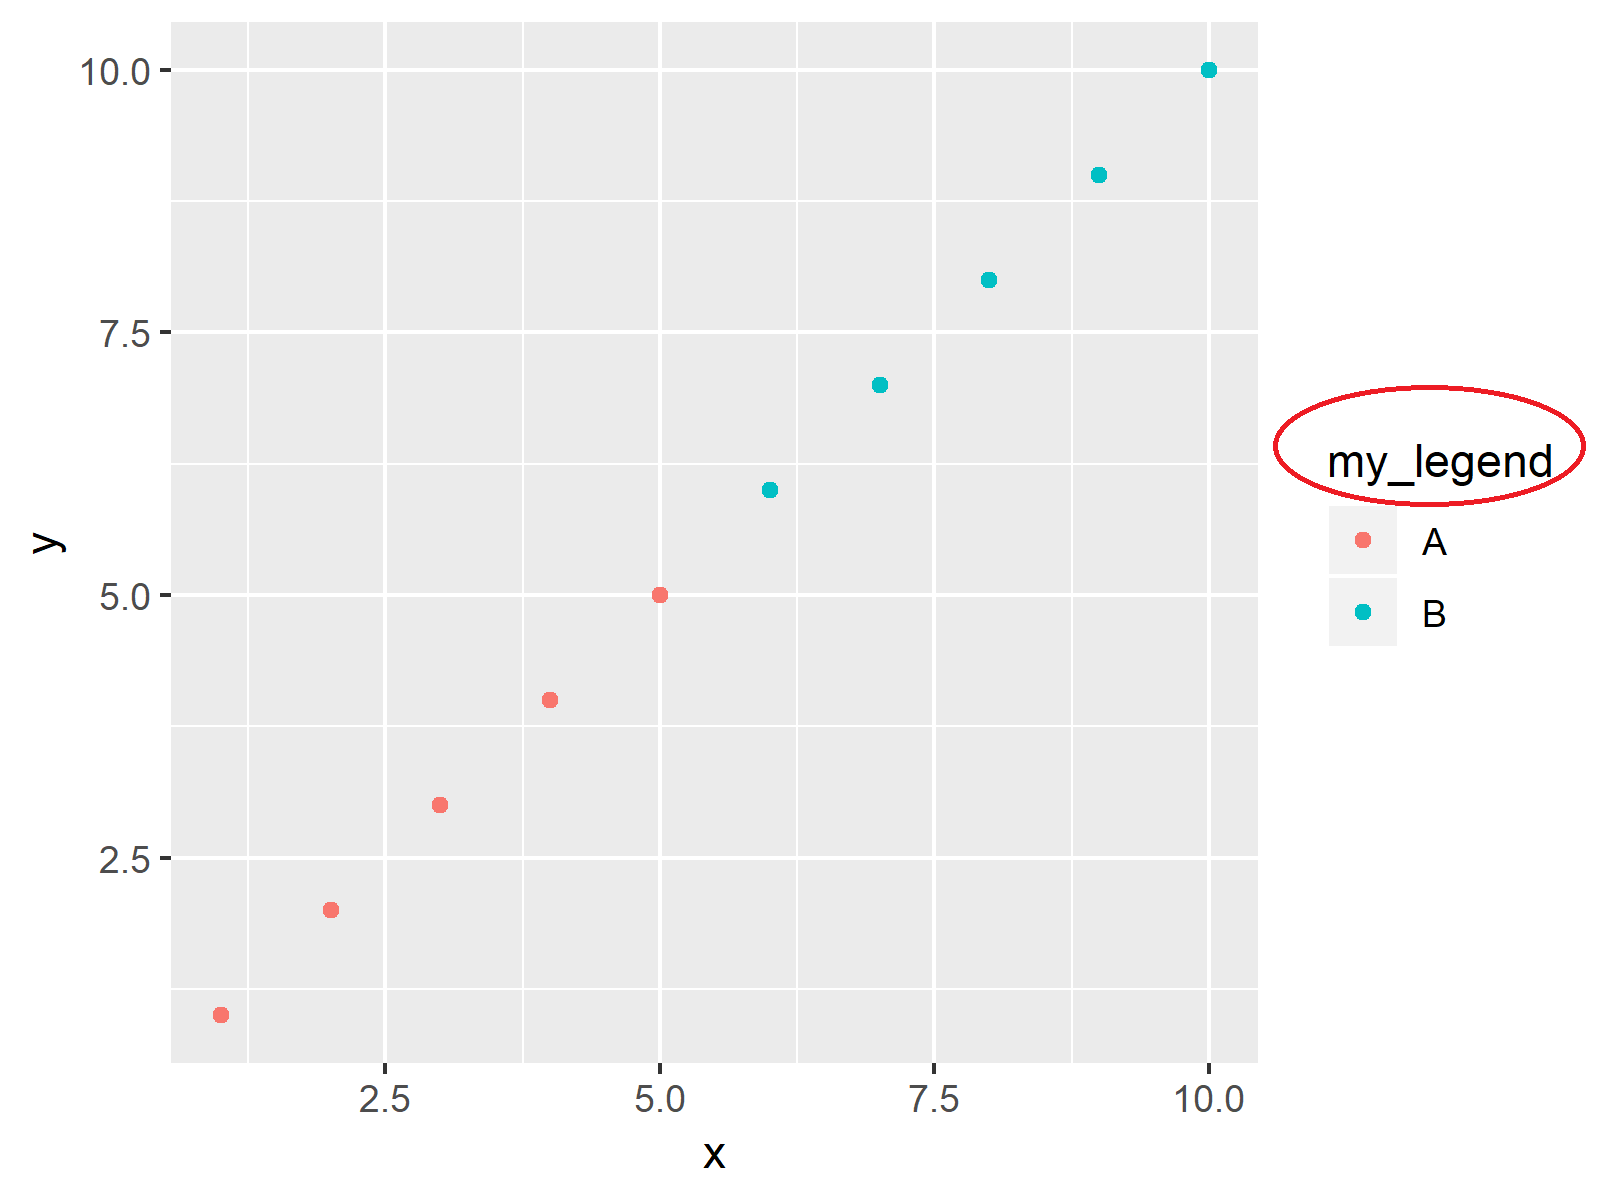
Creating default plot:
my_ggplot <- ggplot(my_data, aes(x, y, group = my_legend)) + # ggplot2 with legend geom_point(aes(x, y, color = my_legend)) my_ggplot # Print plot |
my_ggplot <- ggplot(my_data, aes(x, y, group = my_legend)) + # ggplot2 with legend geom_point(aes(x, y, color = my_legend)) my_ggplot # Print plot

Removing Legend from ggplot2 Plot
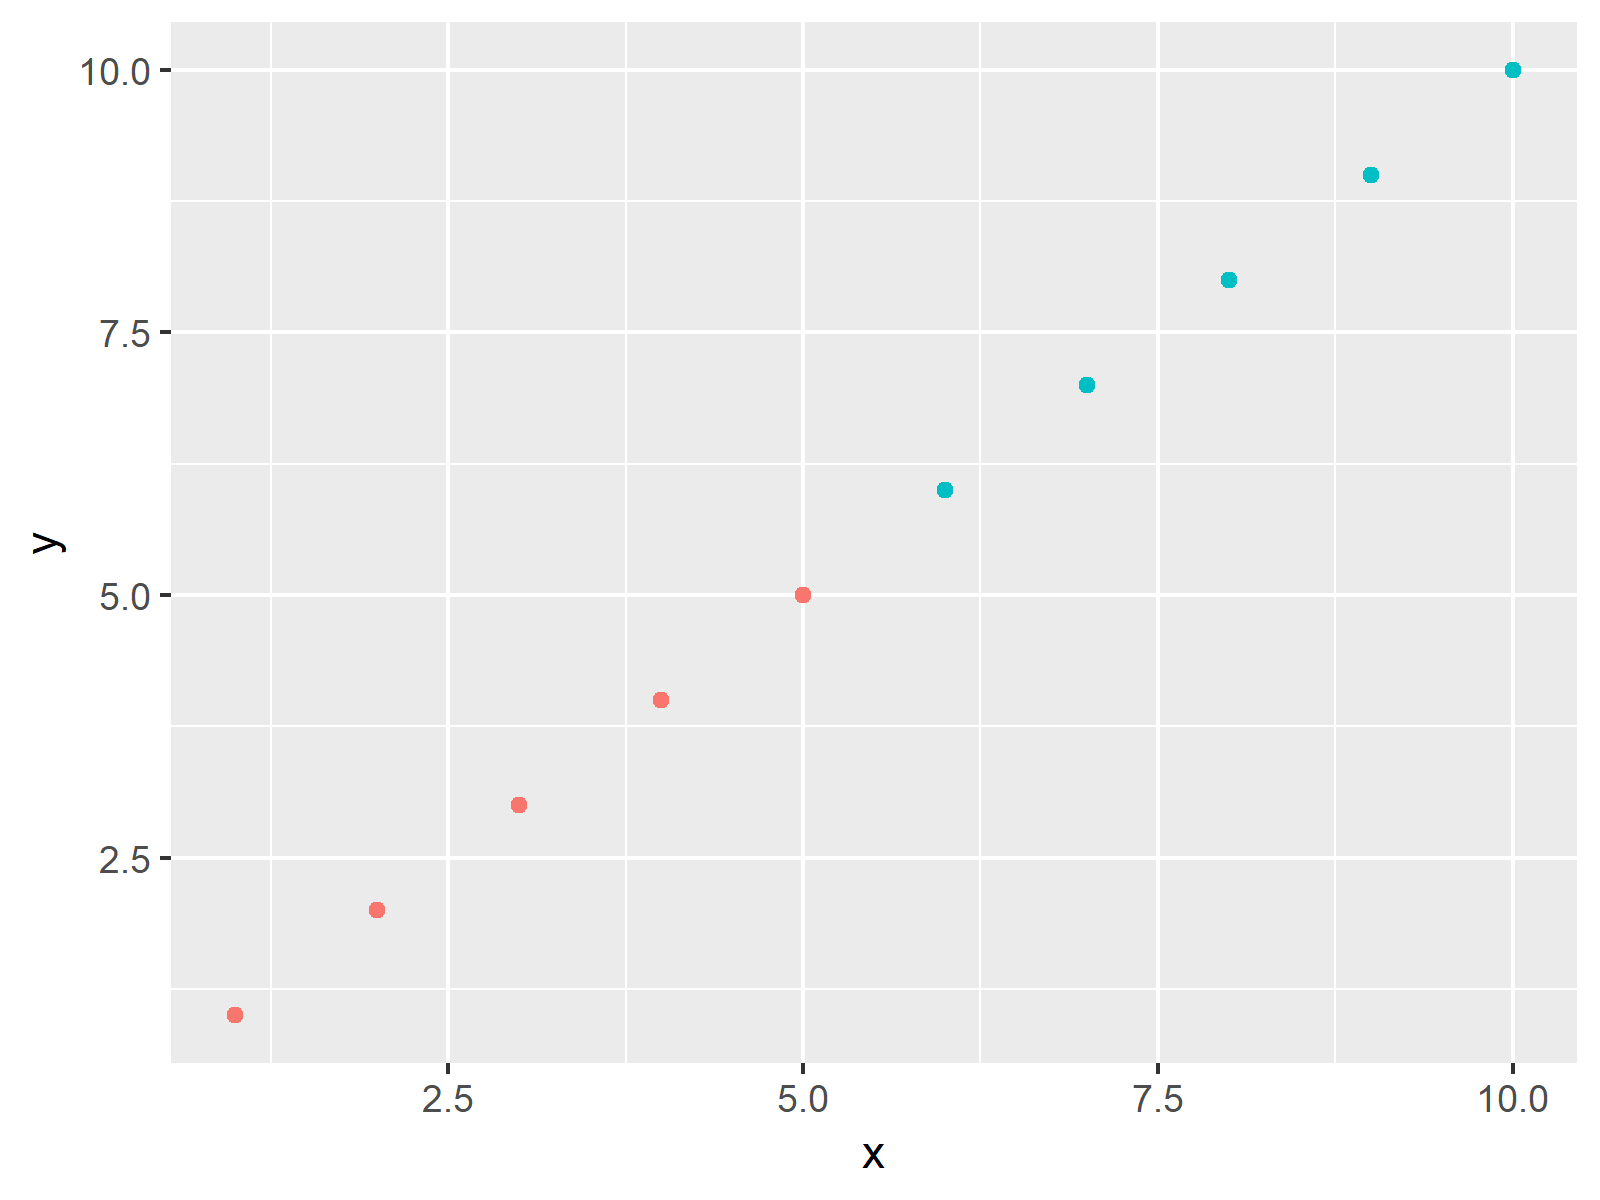
We can specify the argument legend.position = “none” within the theme() function in order to delete the legend from our plot:
my_ggplot + theme(legend.position = "none") # Remove legend from plot |
my_ggplot + theme(legend.position = "none") # Remove legend from plot

