Plot Normal, Left & Right Skewed Densities in R (Example Code)
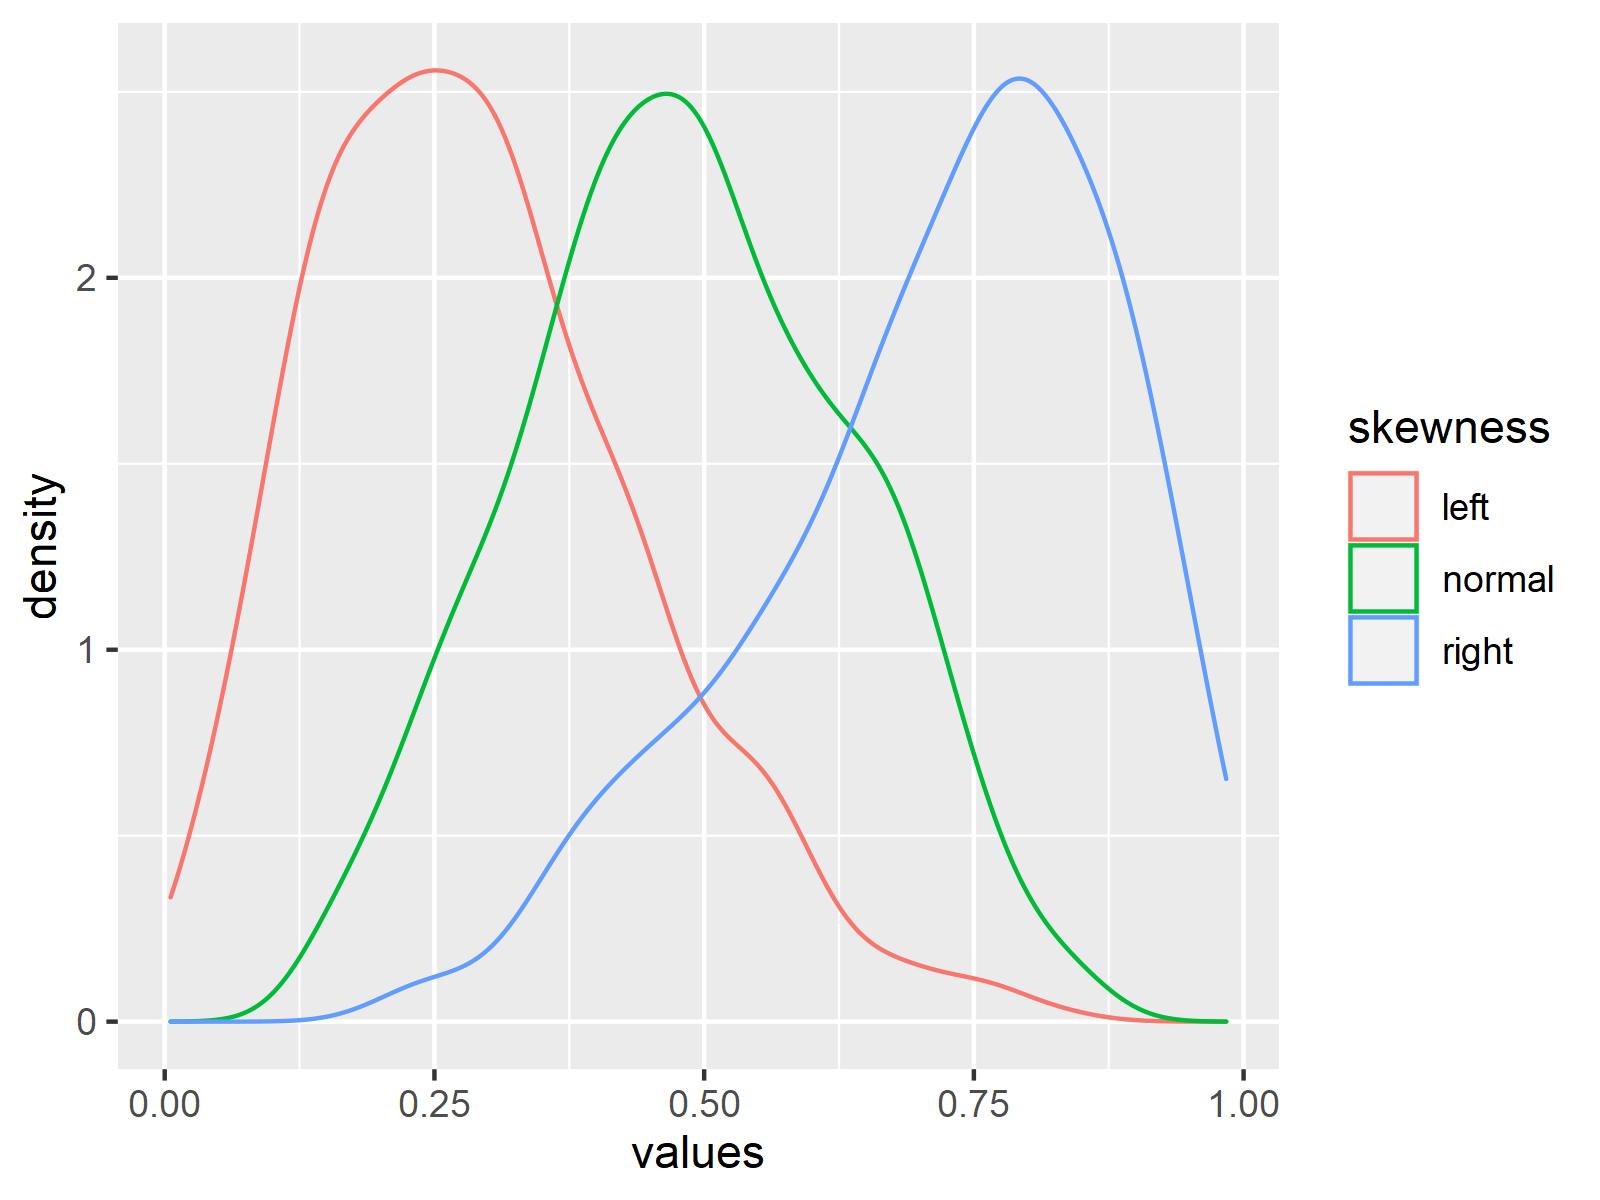
This article explains how to create a plot of normal, left, and right skewed densities in the R programming language.
Creating Example Data
set.seed(5698320) # Create example data frame my_df <- data.frame(values = c(rbeta(500, 5, 2), rbeta(500, 5, 5), rbeta(500, 2, 5)), skewness = rep(c("right", "normal", "left"), each = 500)) head(my_df) # Display head of example data # values skewness # 1 0.7893105 right # 2 0.8030419 right # 3 0.9785181 right # 4 0.7854078 right # 5 0.7410255 right # 6 0.2533721 right |
set.seed(5698320) # Create example data frame my_df <- data.frame(values = c(rbeta(500, 5, 2), rbeta(500, 5, 5), rbeta(500, 2, 5)), skewness = rep(c("right", "normal", "left"), each = 500)) head(my_df) # Display head of example data # values skewness # 1 0.7893105 right # 2 0.8030419 right # 3 0.9785181 right # 4 0.7854078 right # 5 0.7410255 right # 6 0.2533721 right
Example: Plot Normal, Left & Right Skewed Distributions Using ggplot2 Package
install.packages("ggplot2") # Install & load ggplot2 package library("ggplot2") |
install.packages("ggplot2") # Install & load ggplot2 package library("ggplot2")
ggplot(my_df, # Normal, left & right skewed densities aes(x = values, color = skewness)) + geom_density() |
ggplot(my_df, # Normal, left & right skewed densities aes(x = values, color = skewness)) + geom_density()

