How to Modify X-Axis Labels of Boxplot in R (Example Code)
In this R tutorial you’ll learn how to modify boxplot axis labels.
Example Data
data(iris) # Iris data set iris_num <- iris[ , 1:4] # Extract numeric data head(iris_num) # Head of data # Sepal.Length Sepal.Width Petal.Length Petal.Width # 1 5.1 3.5 1.4 0.2 # 2 4.9 3.0 1.4 0.2 # 3 4.7 3.2 1.3 0.2 # 4 4.6 3.1 1.5 0.2 # 5 5.0 3.6 1.4 0.2 # 6 5.4 3.9 1.7 0.4 |
data(iris) # Iris data set iris_num <- iris[ , 1:4] # Extract numeric data head(iris_num) # Head of data # Sepal.Length Sepal.Width Petal.Length Petal.Width # 1 5.1 3.5 1.4 0.2 # 2 4.9 3.0 1.4 0.2 # 3 4.7 3.2 1.3 0.2 # 4 4.6 3.1 1.5 0.2 # 5 5.0 3.6 1.4 0.2 # 6 5.4 3.9 1.7 0.4
Example: Modify X-Axis Labels of Boxplot
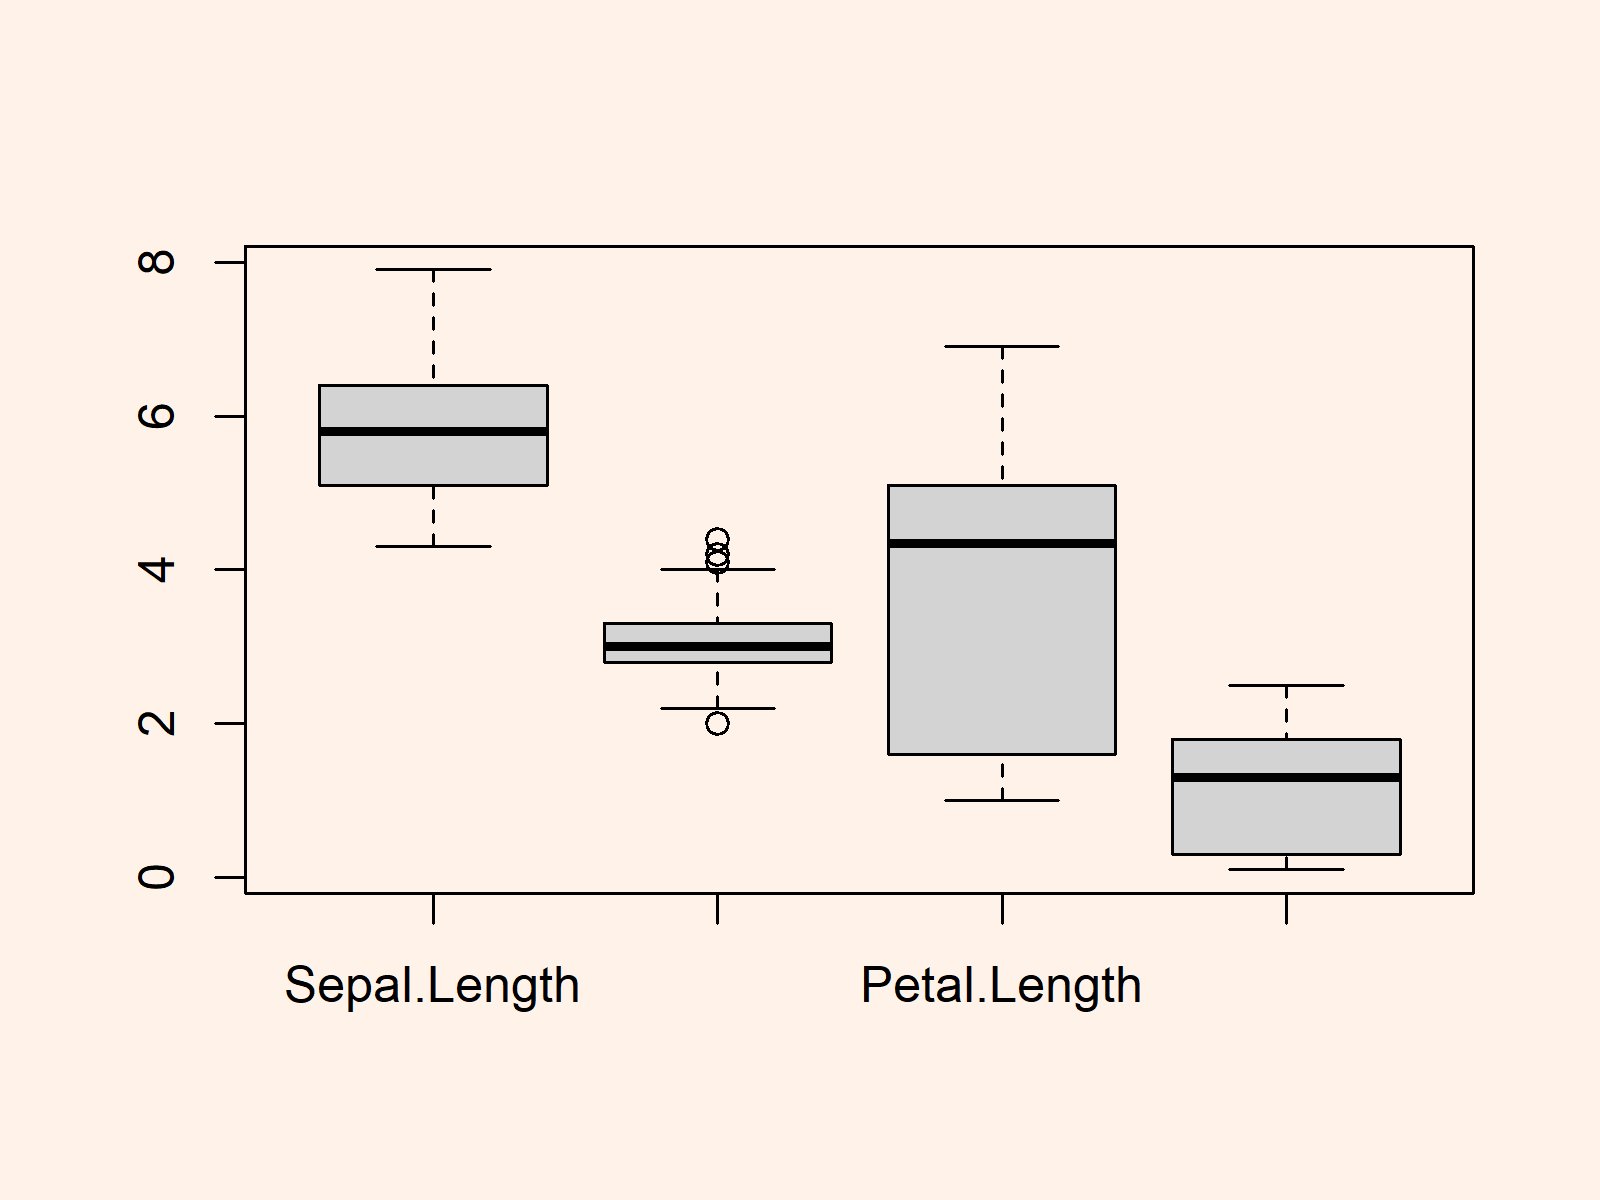
boxplot(iris_num) # Boxplot of iris data set |
boxplot(iris_num) # Boxplot of iris data set

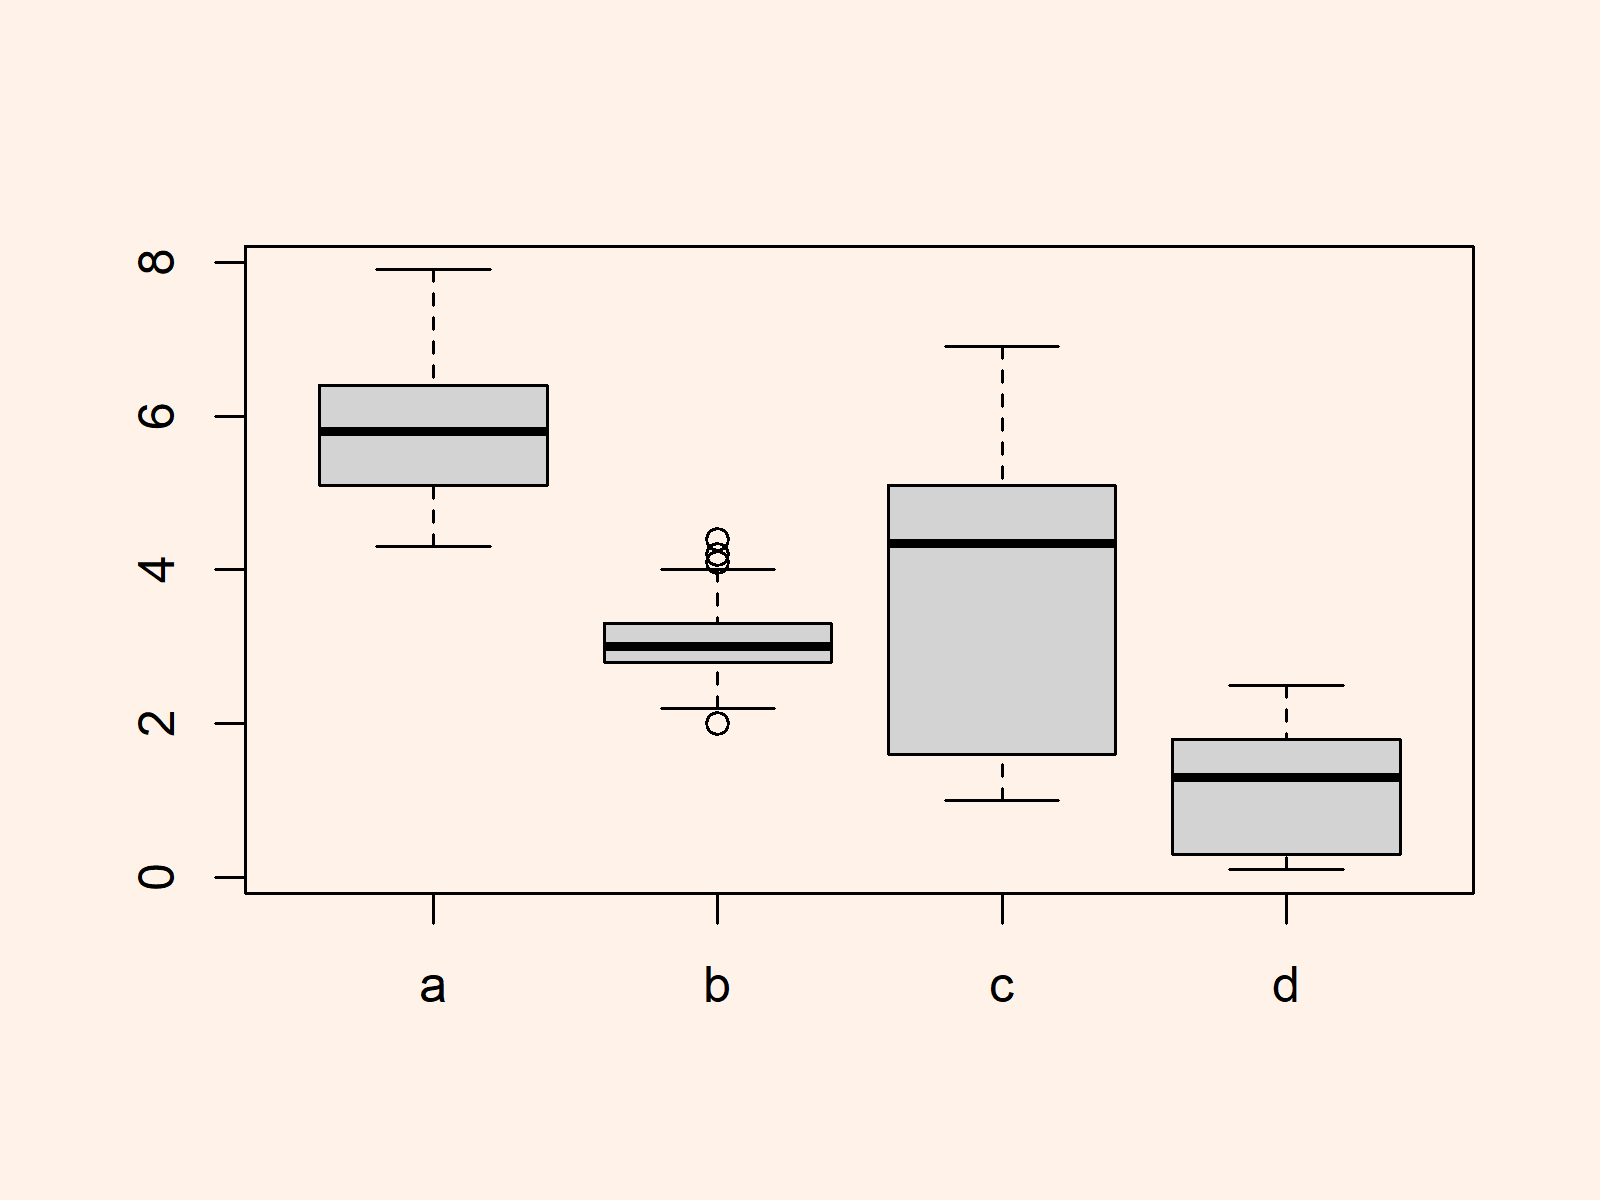
boxplot(iris_num, names = letters[1:4]) # Change axis labels of boxplot |
boxplot(iris_num, names = letters[1:4]) # Change axis labels of boxplot

