Mark Outliers in Plots in R With Text (2 Examples)
In this article, I’ll show how to mark outliers in plots in the R programming language. More precisely: We will be adding text to outliers like their value or label.
Setting up the Examples
We need two packages: data.table and ggplot2.
install.packages("data.table") # Install data.table package library("data.table") # Load data.table install.packages("ggplot2") # Install ggplot2 package library("ggplot2") # Load ggplot2 |
install.packages("data.table") # Install data.table package library("data.table") # Load data.table install.packages("ggplot2") # Install ggplot2 package library("ggplot2") # Load ggplot2
We use the iris dataset for an illustration.
data(iris) # Load iris data set head(iris) # Print head of data # Sepal.Length Sepal.Width Petal.Length Petal.Width Species # 1 5.1 3.5 1.4 0.2 setosa # 2 4.9 3.0 1.4 0.2 setosa # 3 4.7 3.2 1.3 0.2 setosa # 4 4.6 3.1 1.5 0.2 setosa # 5 5.0 3.6 1.4 0.2 setosa # 6 5.4 3.9 1.7 0.4 setosa |
data(iris) # Load iris data set head(iris) # Print head of data # Sepal.Length Sepal.Width Petal.Length Petal.Width Species # 1 5.1 3.5 1.4 0.2 setosa # 2 4.9 3.0 1.4 0.2 setosa # 3 4.7 3.2 1.3 0.2 setosa # 4 4.6 3.1 1.5 0.2 setosa # 5 5.0 3.6 1.4 0.2 setosa # 6 5.4 3.9 1.7 0.4 setosa
Example 1: ggplot Boxplot With Outlier Labels and Values
We start with boxplots and add two additional columns to the data: One called out for indicating whether an observation is an outlier or not and one called id, containing the row number of an observation.
iris$out <- FALSE # New column for outliers iris$id <- 1:nrow(iris) # New column with row names |
iris$out <- FALSE # New column for outliers iris$id <- 1:nrow(iris) # New column with row names
Now, lets see which observations are displayed as outliers in a ggplot. The formulas for identifying the outliers can be found here.
for ( Species_i in unique(iris$Species) ) { quant <- quantile(iris$Petal.Width[iris$Species == Species_i]) inter_quar_r <- quant[4] - quant[2] iris$out[iris$Species == Species_i] <- iris$Petal.Width[iris$Species == Species_i] < (quant[2] - 1.5 * inter_quar_r) | iris$Petal.Width[iris$Species == Species_i] > (quant[4] + 1.5 * inter_quar_r) } |
for ( Species_i in unique(iris$Species) ) { quant <- quantile(iris$Petal.Width[iris$Species == Species_i]) inter_quar_r <- quant[4] - quant[2] iris$out[iris$Species == Species_i] <- iris$Petal.Width[iris$Species == Species_i] < (quant[2] - 1.5 * inter_quar_r) | iris$Petal.Width[iris$Species == Species_i] > (quant[4] + 1.5 * inter_quar_r) }
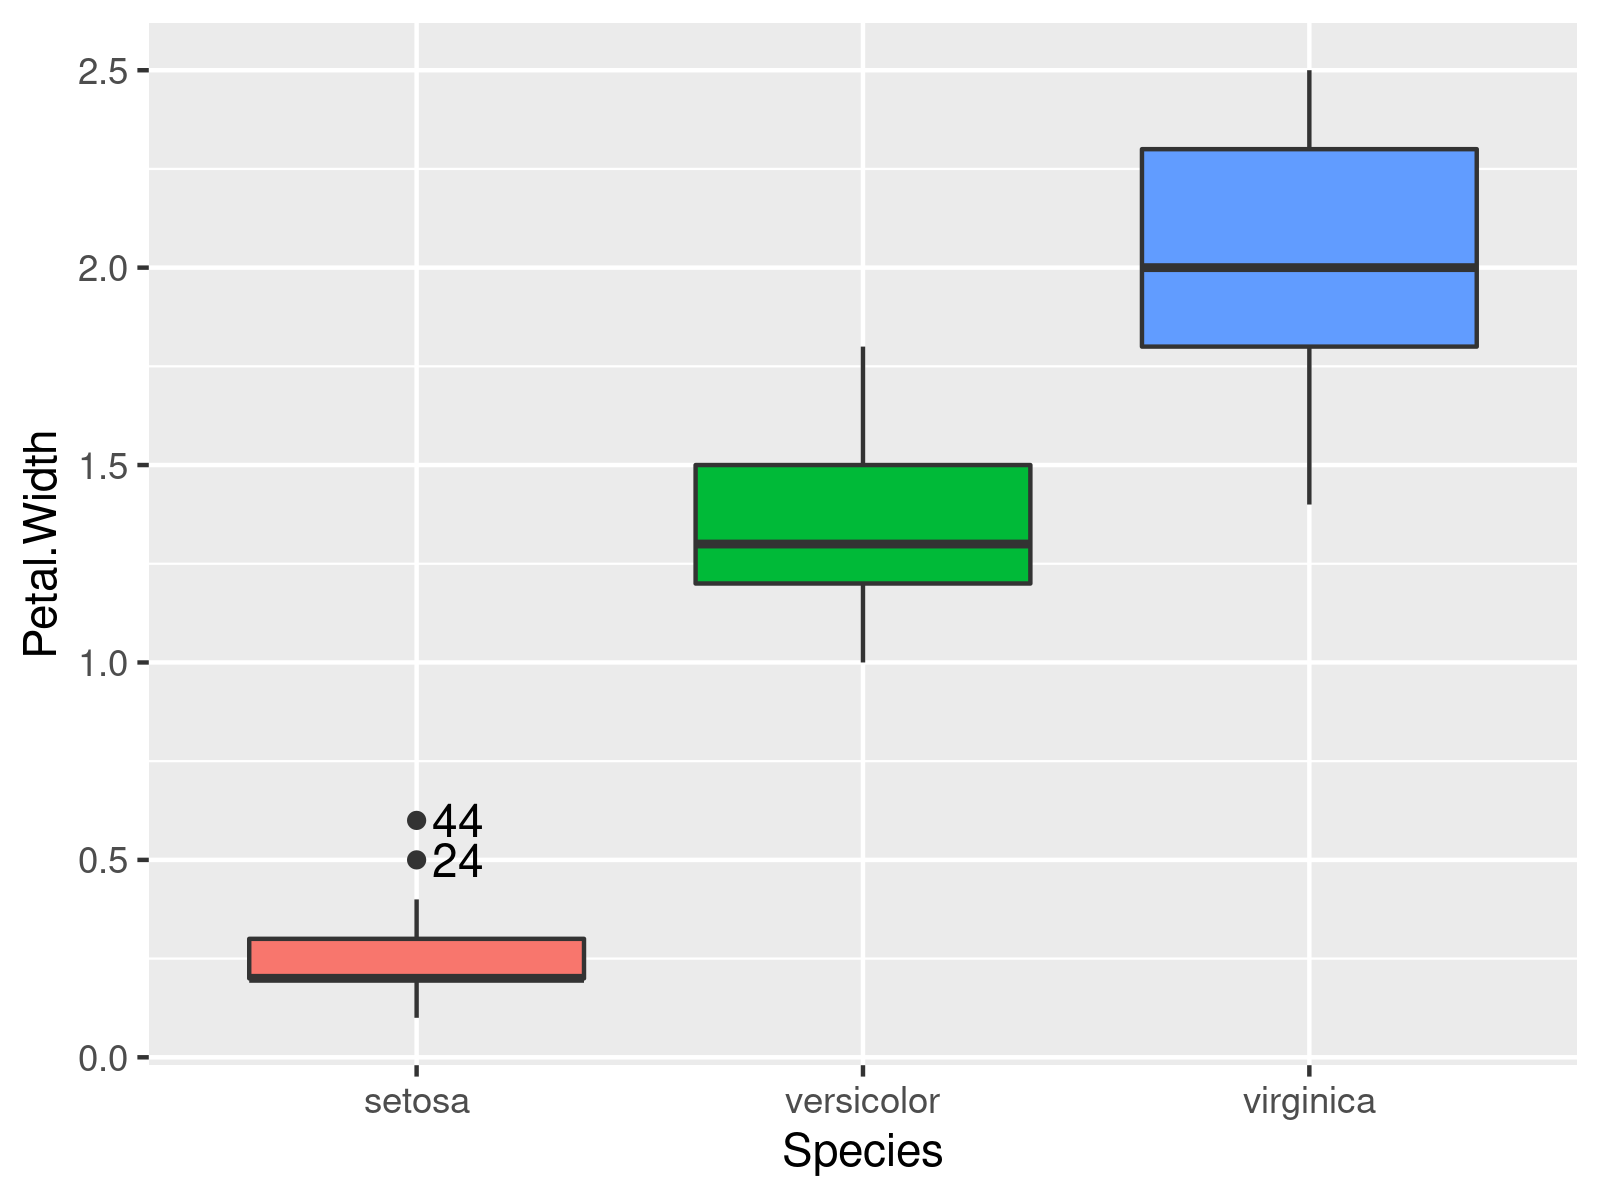
Now we have all the information we need for the plot. Let us plot the data and add the row number of the outliers via geom_text().
ggplot2::ggplot(iris, # Adding outlier ids to the plot aes(x = Species, y = Petal.Width, group = Species, fill = Species)) + geom_boxplot() + geom_text(data = iris[iris$out,], aes(x = Species, y = Petal.Width, label = id), hjust = -.3) + theme(legend.position = "none") |
ggplot2::ggplot(iris, # Adding outlier ids to the plot aes(x = Species, y = Petal.Width, group = Species, fill = Species)) + geom_boxplot() + geom_text(data = iris[iris$out,], aes(x = Species, y = Petal.Width, label = id), hjust = -.3) + theme(legend.position = "none")

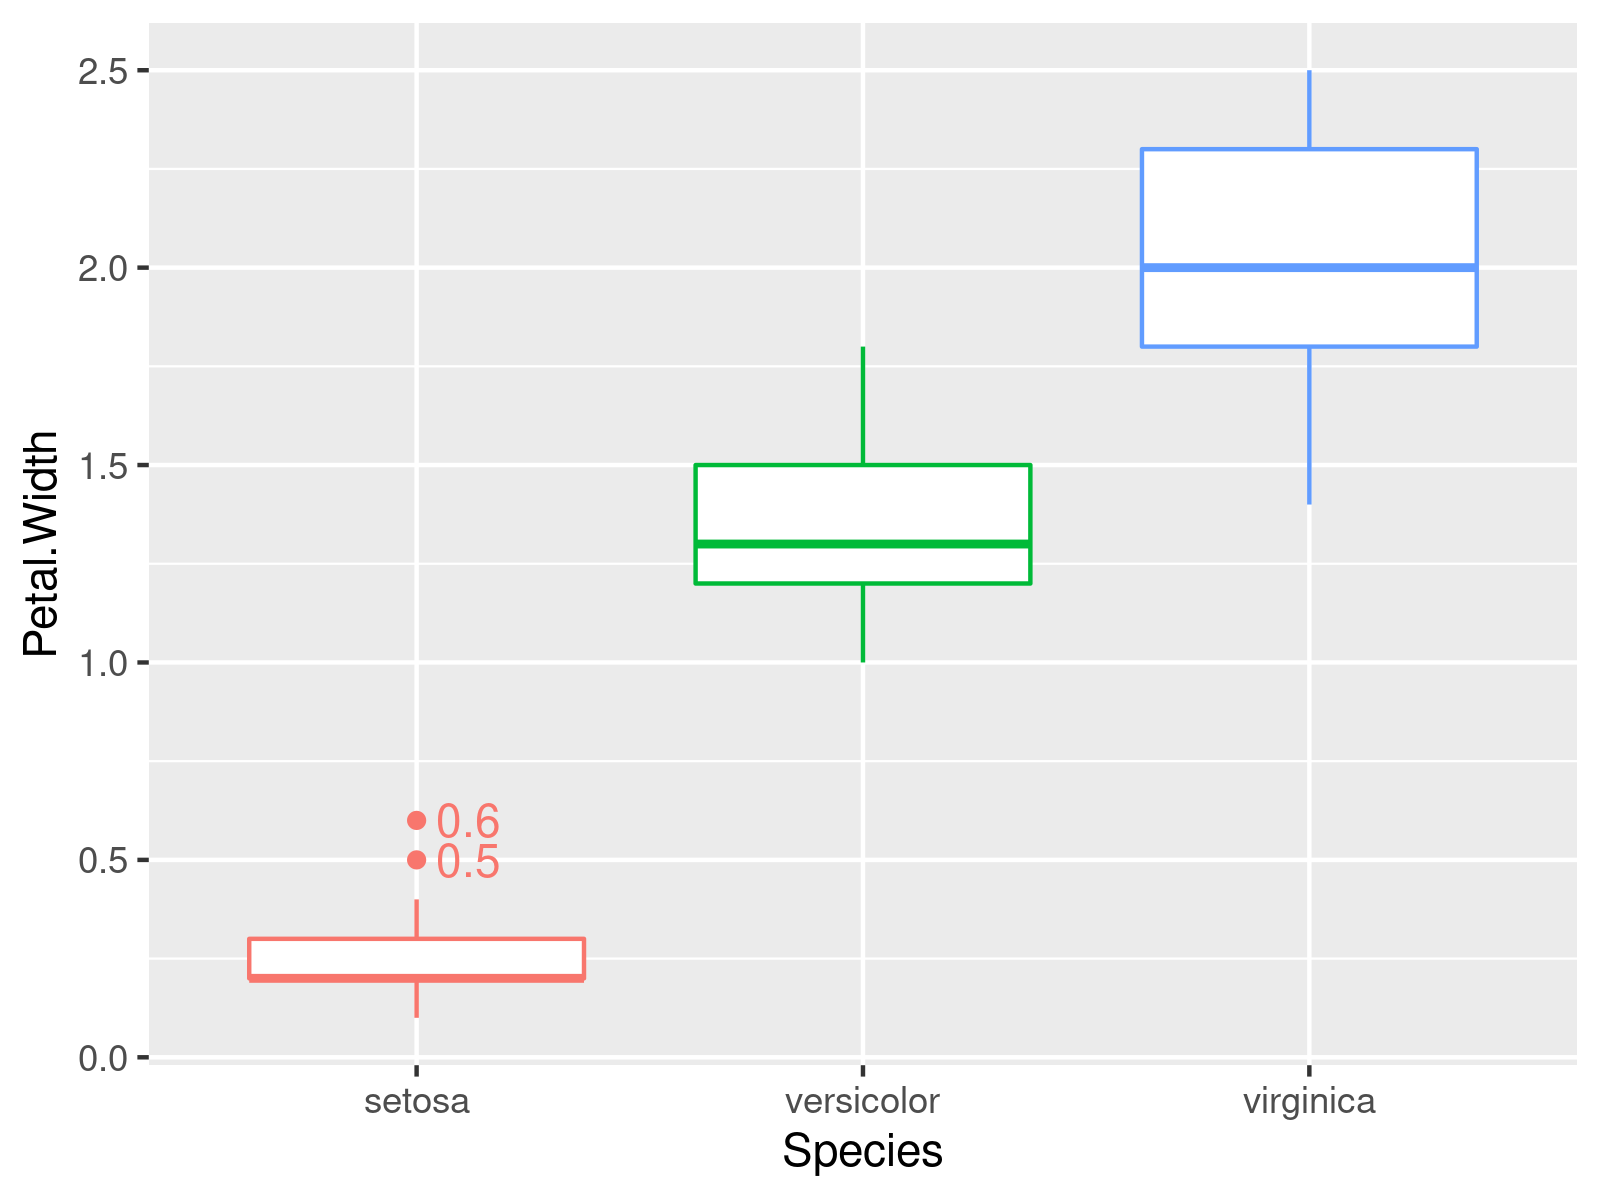
In this example, we add the outlier values instead of their row numbers (and play around with the colors a little bit 🙂 ).
ggplot2::ggplot(iris, # Adding outlier values to the plot aes(x = Species, y = Petal.Width, group = Species, color = Species)) + geom_boxplot() + geom_text(data = iris[iris$out,], aes(x = Species, y = Petal.Width, label = Petal.Width), hjust = -.3) + theme(legend.position = "none") |
ggplot2::ggplot(iris, # Adding outlier values to the plot aes(x = Species, y = Petal.Width, group = Species, color = Species)) + geom_boxplot() + geom_text(data = iris[iris$out,], aes(x = Species, y = Petal.Width, label = Petal.Width), hjust = -.3) + theme(legend.position = "none")

Example 2: ggplot Scatterplot With Outlier Labels and Values
We can also add outlier text in scatterplots. Here is how.
Again, we identify the outliers in the iris data (as shown in the example before).
iris$out <- FALSE # New column for outliers iris$id <- 1:nrow(iris) # New column with row names |
iris$out <- FALSE # New column for outliers iris$id <- 1:nrow(iris) # New column with row names
for ( Species_i in unique(iris$Species) ) { quant <- quantile(iris$Petal.Width[iris$Species == Species_i]) inter_quar_r <- quant[4] - quant[2] iris$out[iris$Species == Species_i] <- iris$Petal.Width[iris$Species == Species_i] < (quant[2] - 1.5 * inter_quar_r) | iris$Petal.Width[iris$Species == Species_i] > (quant[4] + 1.5 * inter_quar_r) } iris$id2 <- iris$id iris$id2[!iris$out] <- NA iris$Petal.Width2 <- iris$Petal.Width iris$Petal.Width2[!iris$out] <- NA |
for ( Species_i in unique(iris$Species) ) { quant <- quantile(iris$Petal.Width[iris$Species == Species_i]) inter_quar_r <- quant[4] - quant[2] iris$out[iris$Species == Species_i] <- iris$Petal.Width[iris$Species == Species_i] < (quant[2] - 1.5 * inter_quar_r) | iris$Petal.Width[iris$Species == Species_i] > (quant[4] + 1.5 * inter_quar_r) } iris$id2 <- iris$id iris$id2[!iris$out] <- NA iris$Petal.Width2 <- iris$Petal.Width iris$Petal.Width2[!iris$out] <- NA
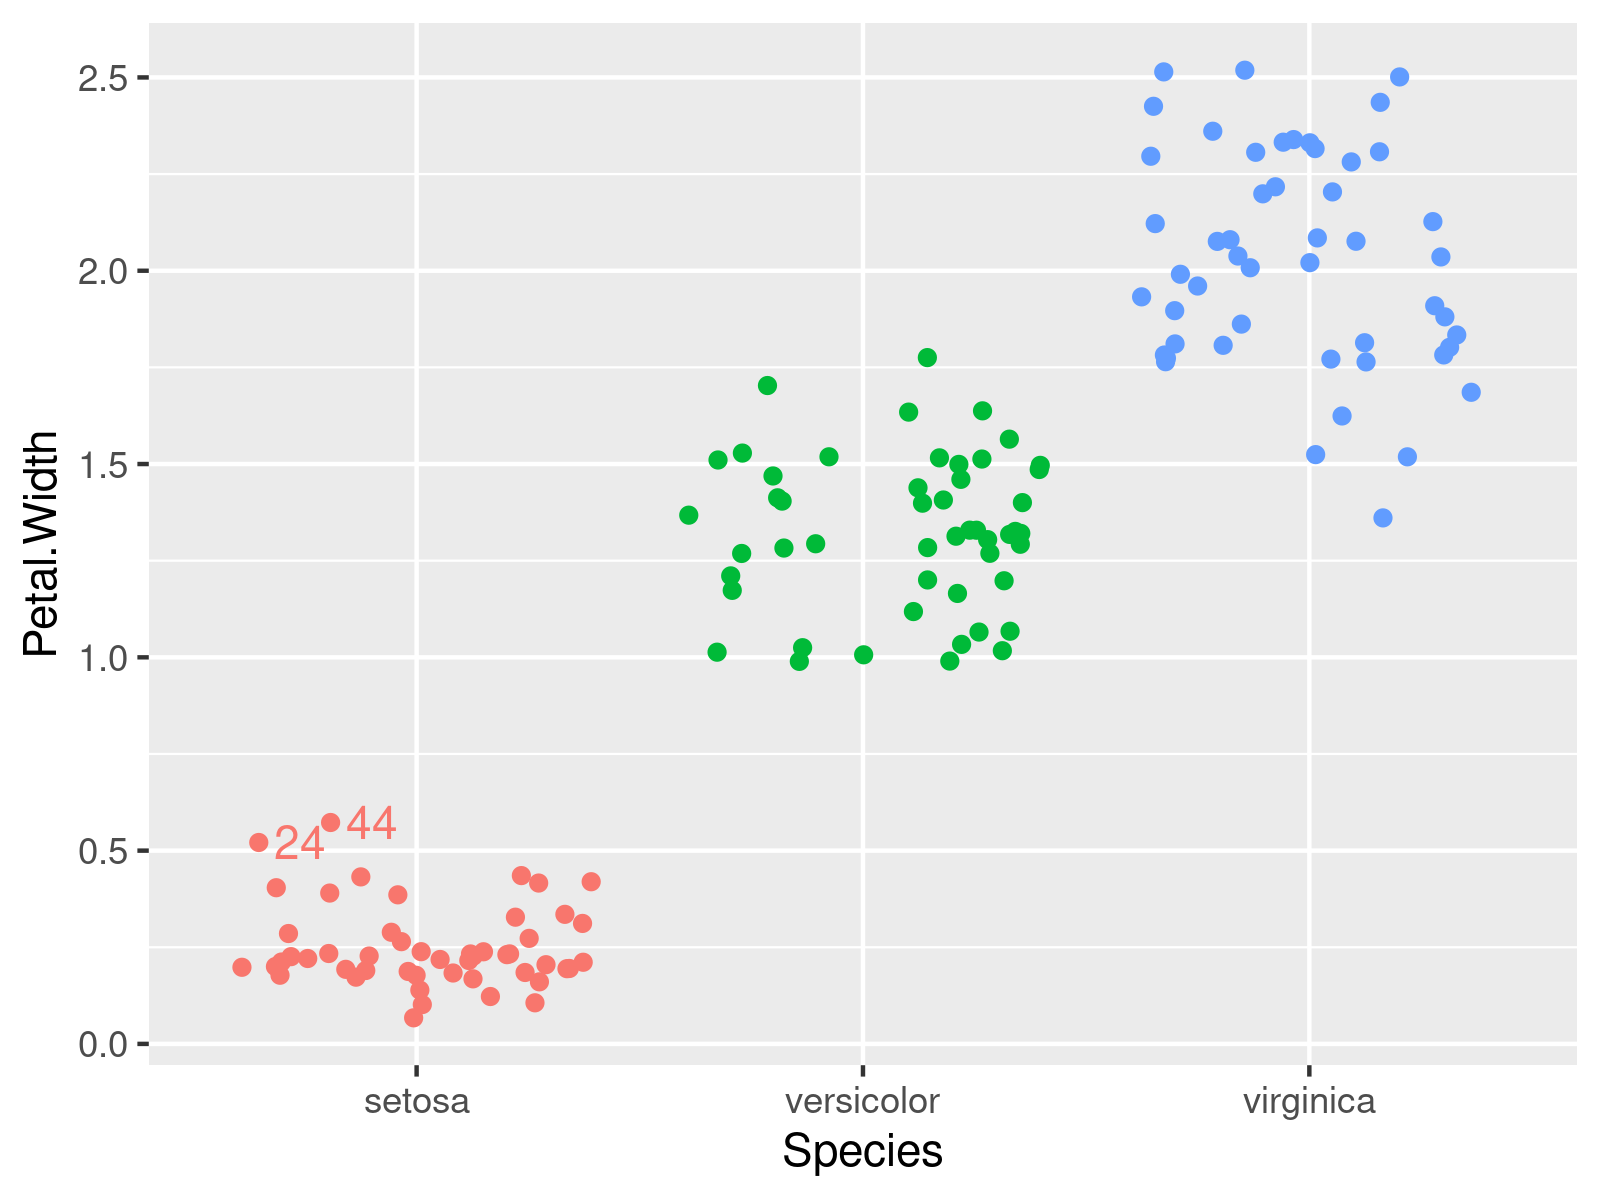
We plot the data and add the outlier position via geom_text(). In the code, we carefully take care that the outlier text is aligned to the jitter position of the points.
ggplot2::ggplot(iris, # Adding outlier ids to the plot aes(x = Species, y = Petal.Width, group = Species, color = Species)) + geom_jitter(position = position_jitter(seed = 15)) + geom_text(data = iris, aes(x = Species, y = Petal.Width, label = id2), hjust = -.3, position = position_jitter(seed = 15)) + theme(legend.position = "none") |
ggplot2::ggplot(iris, # Adding outlier ids to the plot aes(x = Species, y = Petal.Width, group = Species, color = Species)) + geom_jitter(position = position_jitter(seed = 15)) + geom_text(data = iris, aes(x = Species, y = Petal.Width, label = id2), hjust = -.3, position = position_jitter(seed = 15)) + theme(legend.position = "none")

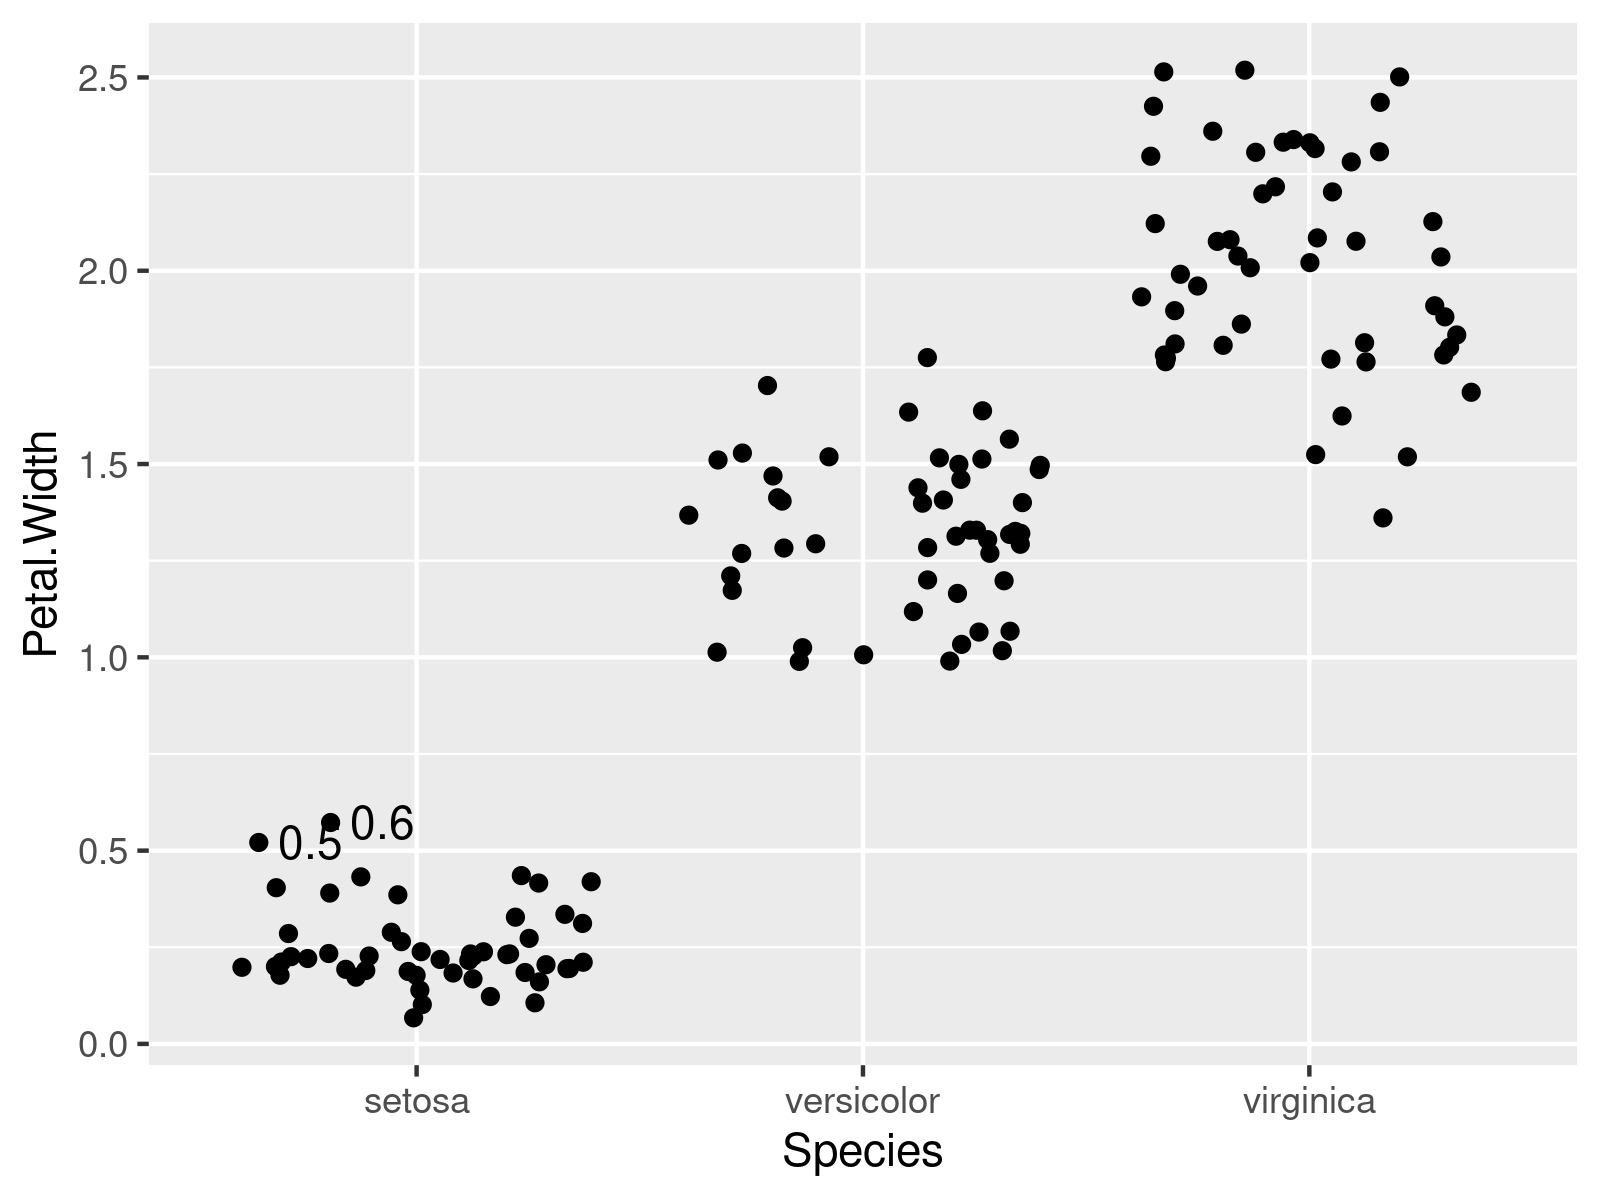
In this example, we add outlier values instead of their labels.
ggplot2::ggplot(iris, # Adding outlier values to the plot aes(x = Species, y = Petal.Width, group = Species)) + geom_jitter(position = position_jitter(seed = 15)) + geom_text(data = iris, aes(x = Species, y = Petal.Width, label = Petal.Width2), hjust = -.3, position = position_jitter(seed = 15)) + theme(legend.position = "none") |
ggplot2::ggplot(iris, # Adding outlier values to the plot aes(x = Species, y = Petal.Width, group = Species)) + geom_jitter(position = position_jitter(seed = 15)) + geom_text(data = iris, aes(x = Species, y = Petal.Width, label = Petal.Width2), hjust = -.3, position = position_jitter(seed = 15)) + theme(legend.position = "none")

Note: This article was created in collaboration with Anna-Lena Wölwer. Anna-Lena is a researcher and programmer who creates tutorials on statistical methodology as well as on the R programming language. You may find more info about Anna-Lena and her other articles on her profile page.

