Increase & Decrease Font Size of Correlation Coefficients in corrplot in R (Example Code)
In this R programming tutorial you’ll learn how to adjust the font size in a corrplot.
Setting up the Example
set.seed(6538744) # Constructing random example data my_mat <- matrix(runif(150), nrow = 15) my_mat # Displaying example data in RStudio console # [,1] [,2] [,3] [,4] [,5] [,6] # [1,] 0.5555343 0.1351731 0.29167531 0.5308111191 0.77544618 0.745655766 # [2,] 0.6231441 0.5012492 0.47620671 0.3794177836 0.97246694 0.383240425 # [3,] 0.9755171 0.3826835 0.33959043 0.6296441981 0.90347122 0.042016209 # [4,] 0.9584367 0.2713603 0.49398269 0.0006312269 0.02969839 0.097715067 # [5,] 0.6121864 0.4615816 0.29531288 0.7347320959 0.73279851 0.002974346 # [6,] 0.1134701 0.5374638 0.14732497 0.5048501268 0.20097623 0.227008911 # [7,] 0.5997935 0.5370306 0.87746093 0.4756394557 0.49093538 0.294160402 # [8,] 0.6979001 0.1835908 0.11312156 0.6290637627 0.44325085 0.778981276 # [9,] 0.7664675 0.4393117 0.81618325 0.0924744143 0.96703278 0.010851758 # [10,] 0.2724322 0.5292984 0.27657049 0.5978128151 0.32682620 0.903130504 # [11,] 0.1828933 0.2676853 0.05134459 0.9279138246 0.23188055 0.767920552 # [12,] 0.9450532 0.8968326 0.70507585 0.3561489643 0.13359980 0.578238767 # [13,] 0.6491961 0.8625700 0.02013610 0.3493584825 0.20382566 0.973815490 # [14,] 0.6585207 0.2832181 0.03696934 0.2008810951 0.98581812 0.561825831 # [15,] 0.6663525 0.1388122 0.33193833 0.6904341842 0.89226436 0.055008562 # [,7] [,8] [,9] [,10] # [1,] 0.81428970 0.32479885 0.10313090 0.4941886 # [2,] 0.07895340 0.55786463 0.29049638 0.3853795 # [3,] 0.67344133 0.14704669 0.26260137 0.3232056 # [4,] 0.14652514 0.37066708 0.07560218 0.1031766 # [5,] 0.16127988 0.92433931 0.87180041 0.9744006 # [6,] 0.23908972 0.91316893 0.16286550 0.8835759 # [7,] 0.77333942 0.89552919 0.37793322 0.6579429 # [8,] 0.27501889 0.22082333 0.30391215 0.1910415 # [9,] 0.83584129 0.02235423 0.84760960 0.3062743 # [10,] 0.95382929 0.94361303 0.21474141 0.8682759 # [11,] 0.09851692 0.91588920 0.94353610 0.7203403 # [12,] 0.98384906 0.36328790 0.46685543 0.5835796 # [13,] 0.76409555 0.55241033 0.55444286 0.8931987 # [14,] 0.12471296 0.56773703 0.36890794 0.2906081 # [15,] 0.46543656 0.74877813 0.54481115 0.6111637 |
install.packages("corrplot") # Install corrplot package library("corrplot") # Load corrplot |
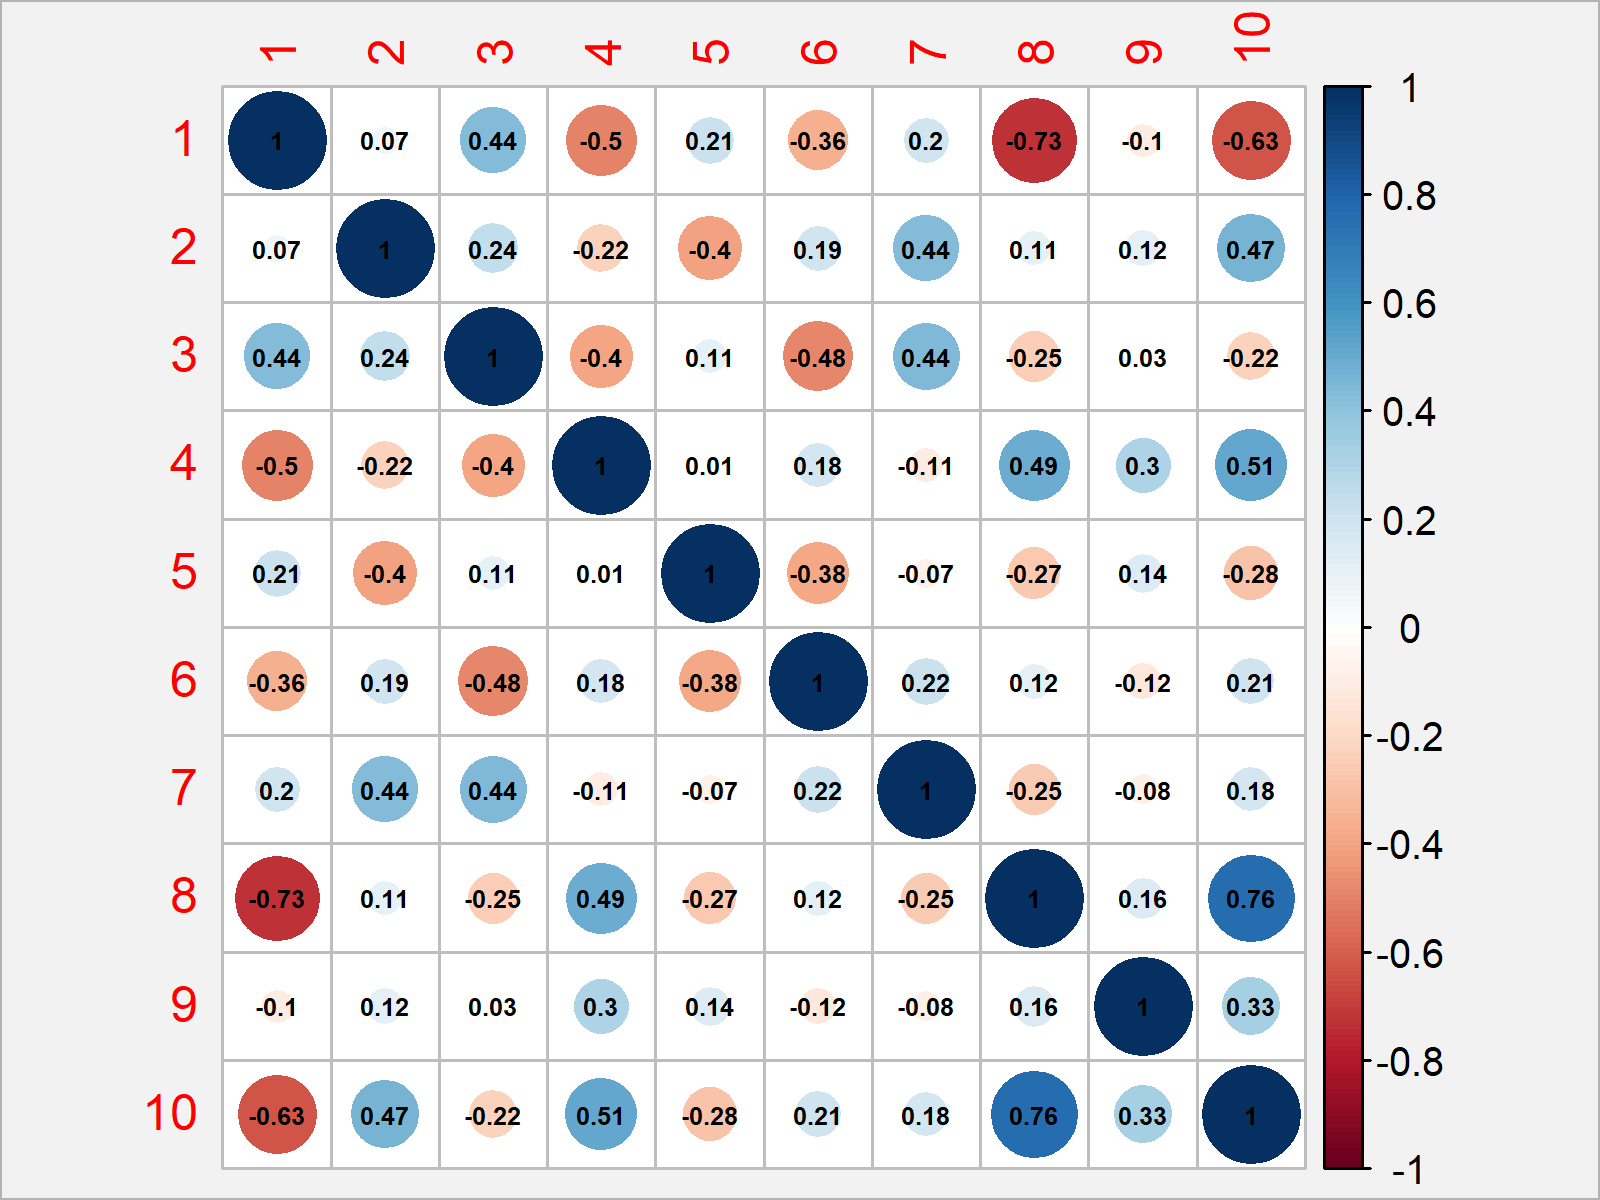
corrplot(cor(my_mat), # Creating a corrplot with default font size addCoef.col = 1) |
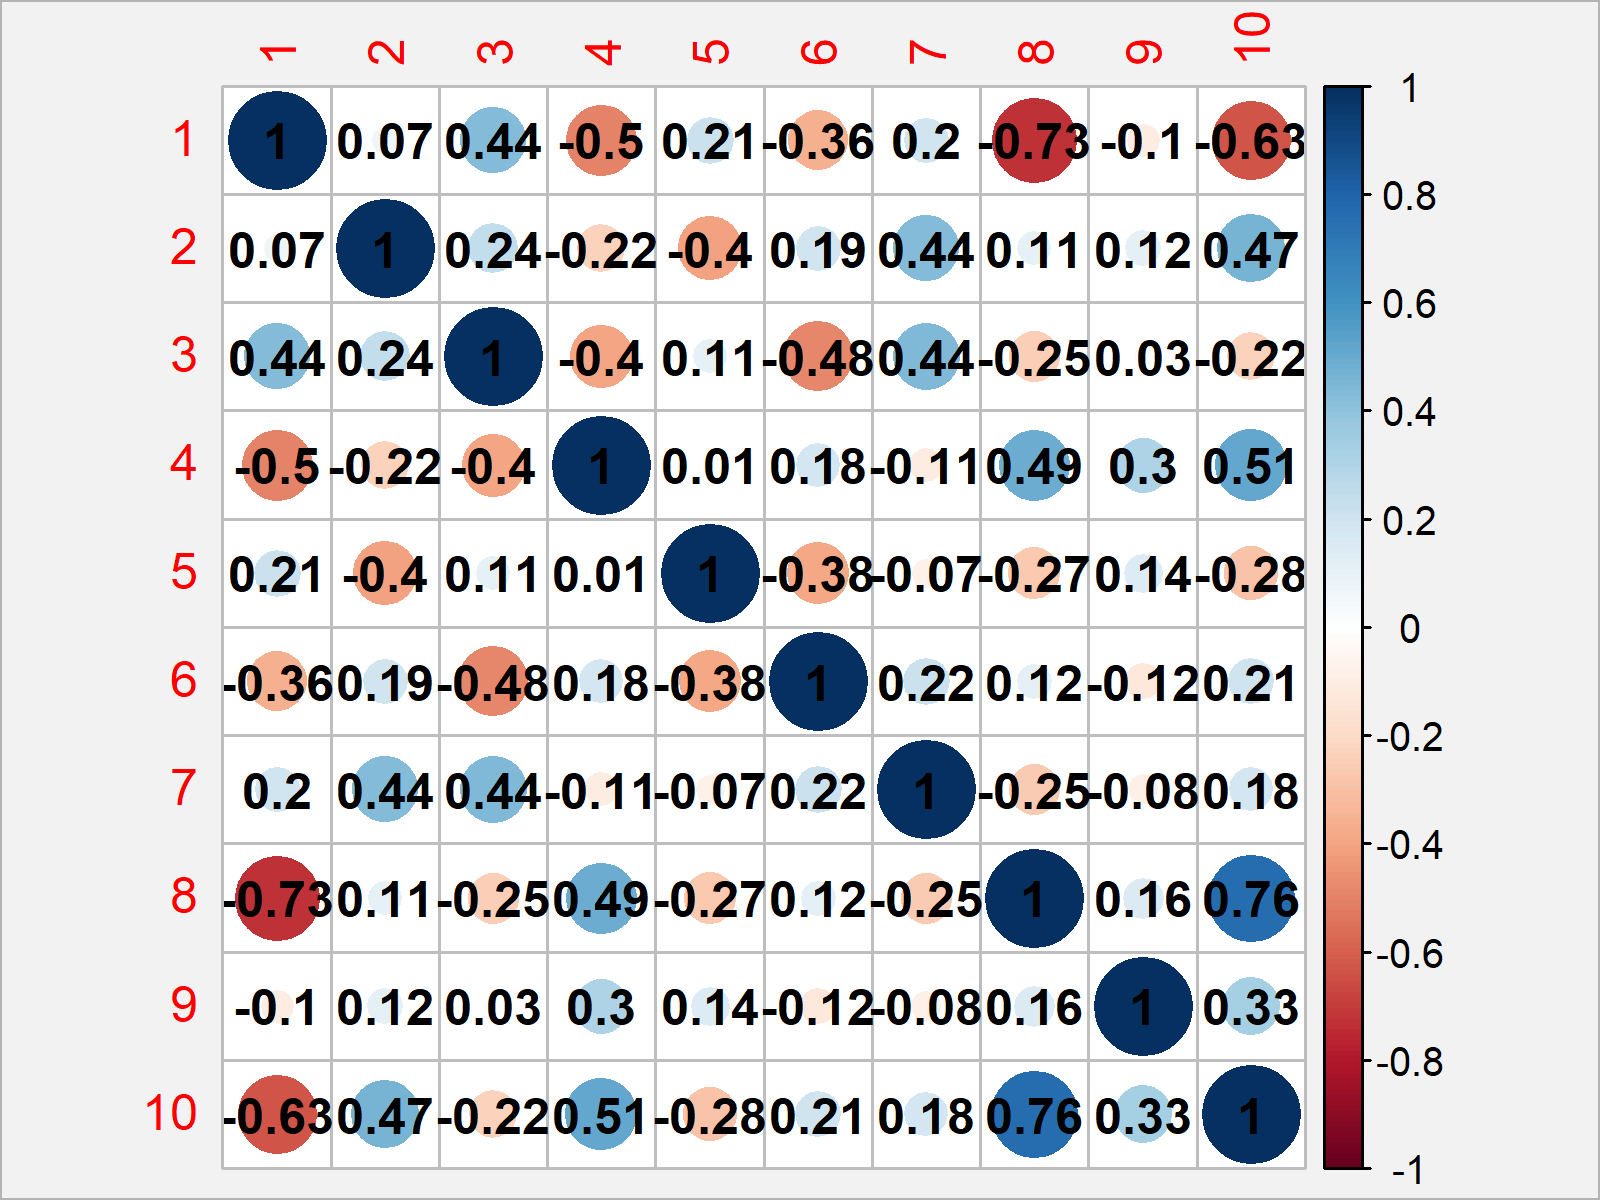
Example: How to Change the Font Size of Correlation Coefficients in a corrplot
corrplot(cor(my_mat), # Modifying font size in corrplot addCoef.col = 1, number.cex = 0.5) |