How to Plot a Function Curve in R Programming (2 Examples)
This article explains how to draw a manually specified function in the R programming language.
Preparing the Examples
manual_function <- function(values) { # User-defined function values^3 - values^2 + values * 50 } |
manual_function <- function(values) { # User-defined function values^3 - values^2 + values * 50 }
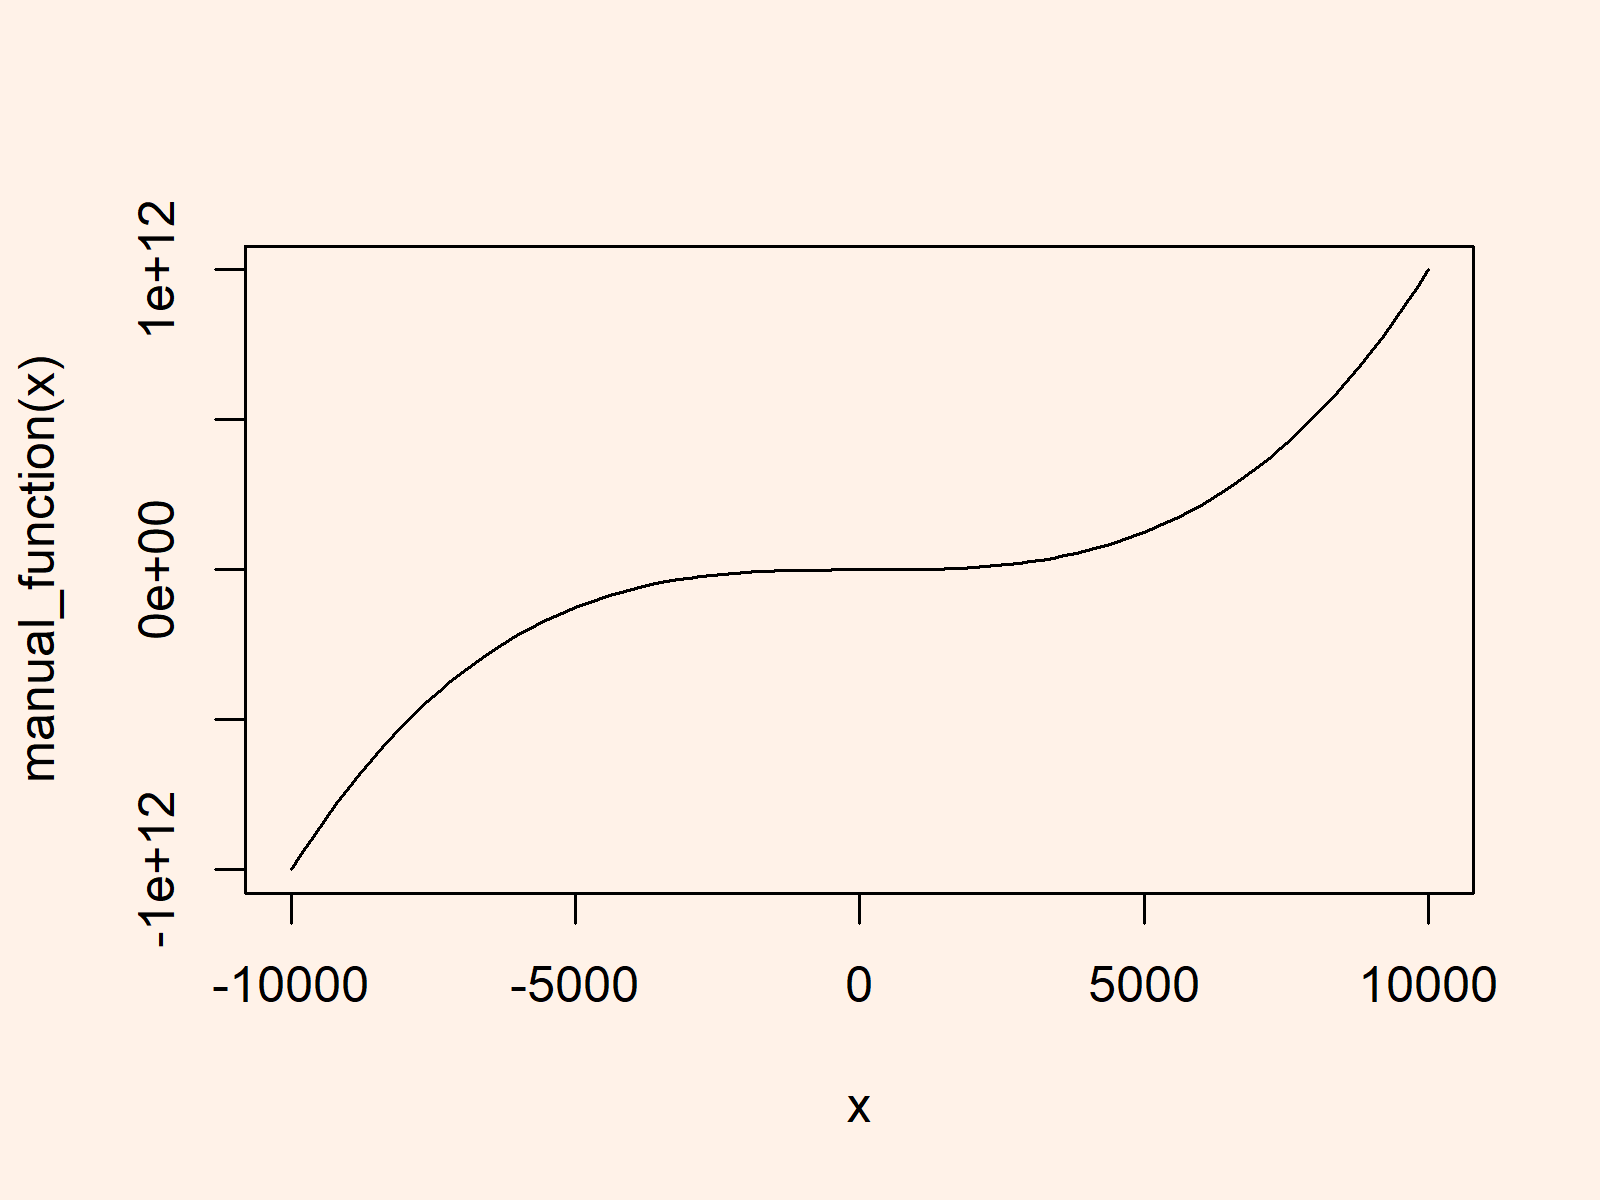
Example 1: Drawing Function Curve with curve() Function
curve(manual_function, # Using curve function from = - 10000, to = 10000) |
curve(manual_function, # Using curve function from = - 10000, to = 10000)

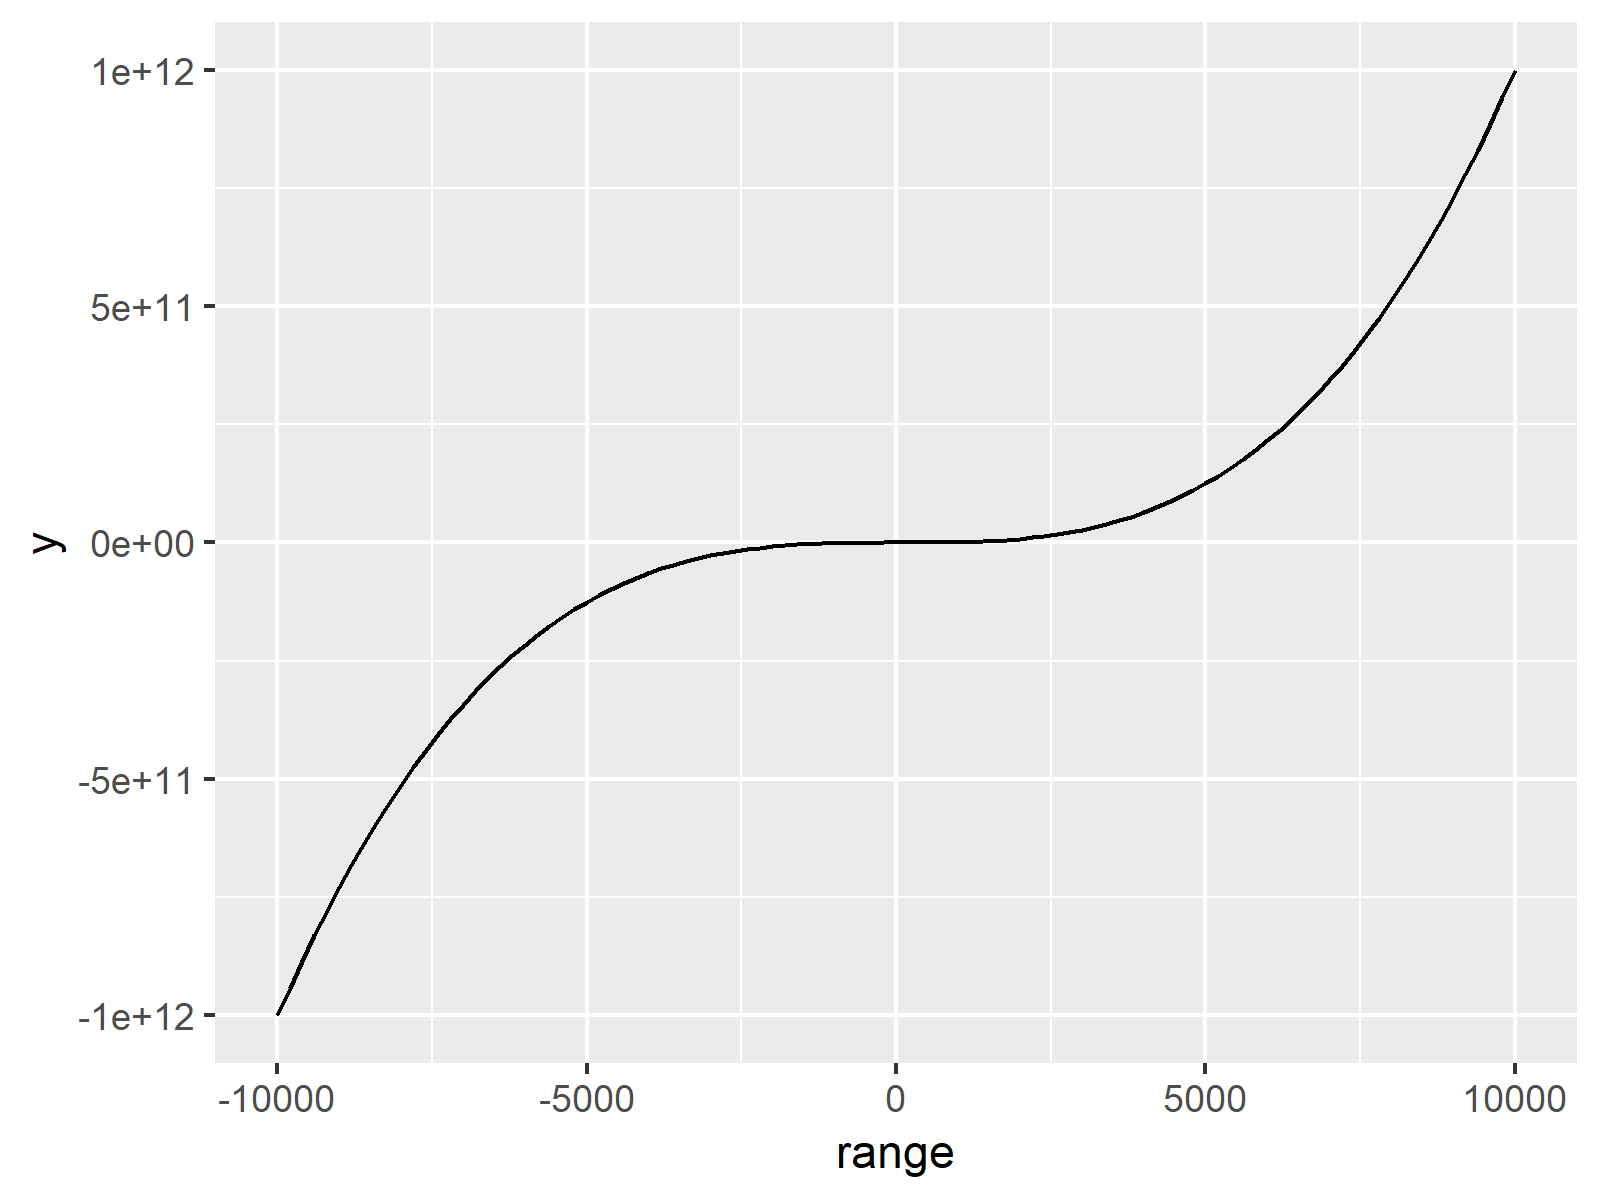
Example 2: Drawing Function Curve with stat_function() of ggplot2 Package
ggplot_data <- data.frame(range = c(- 10000, 10000)) # Data frame for ggplot2 plot |
ggplot_data <- data.frame(range = c(- 10000, 10000)) # Data frame for ggplot2 plot
install.packages("ggplot2") # Install ggplot2 package library("ggplot2") # Load ggplot2 package |
install.packages("ggplot2") # Install ggplot2 package library("ggplot2") # Load ggplot2 package
ggplot(ggplot_data, aes(range)) + # Using ggplot2 package stat_function(fun = manual_function) |
ggplot(ggplot_data, aes(range)) + # Using ggplot2 package stat_function(fun = manual_function)

