How to Apply the text() Function in R (Example Code)
In this R programming tutorial you’ll learn how to add text to graphics using the text() function.
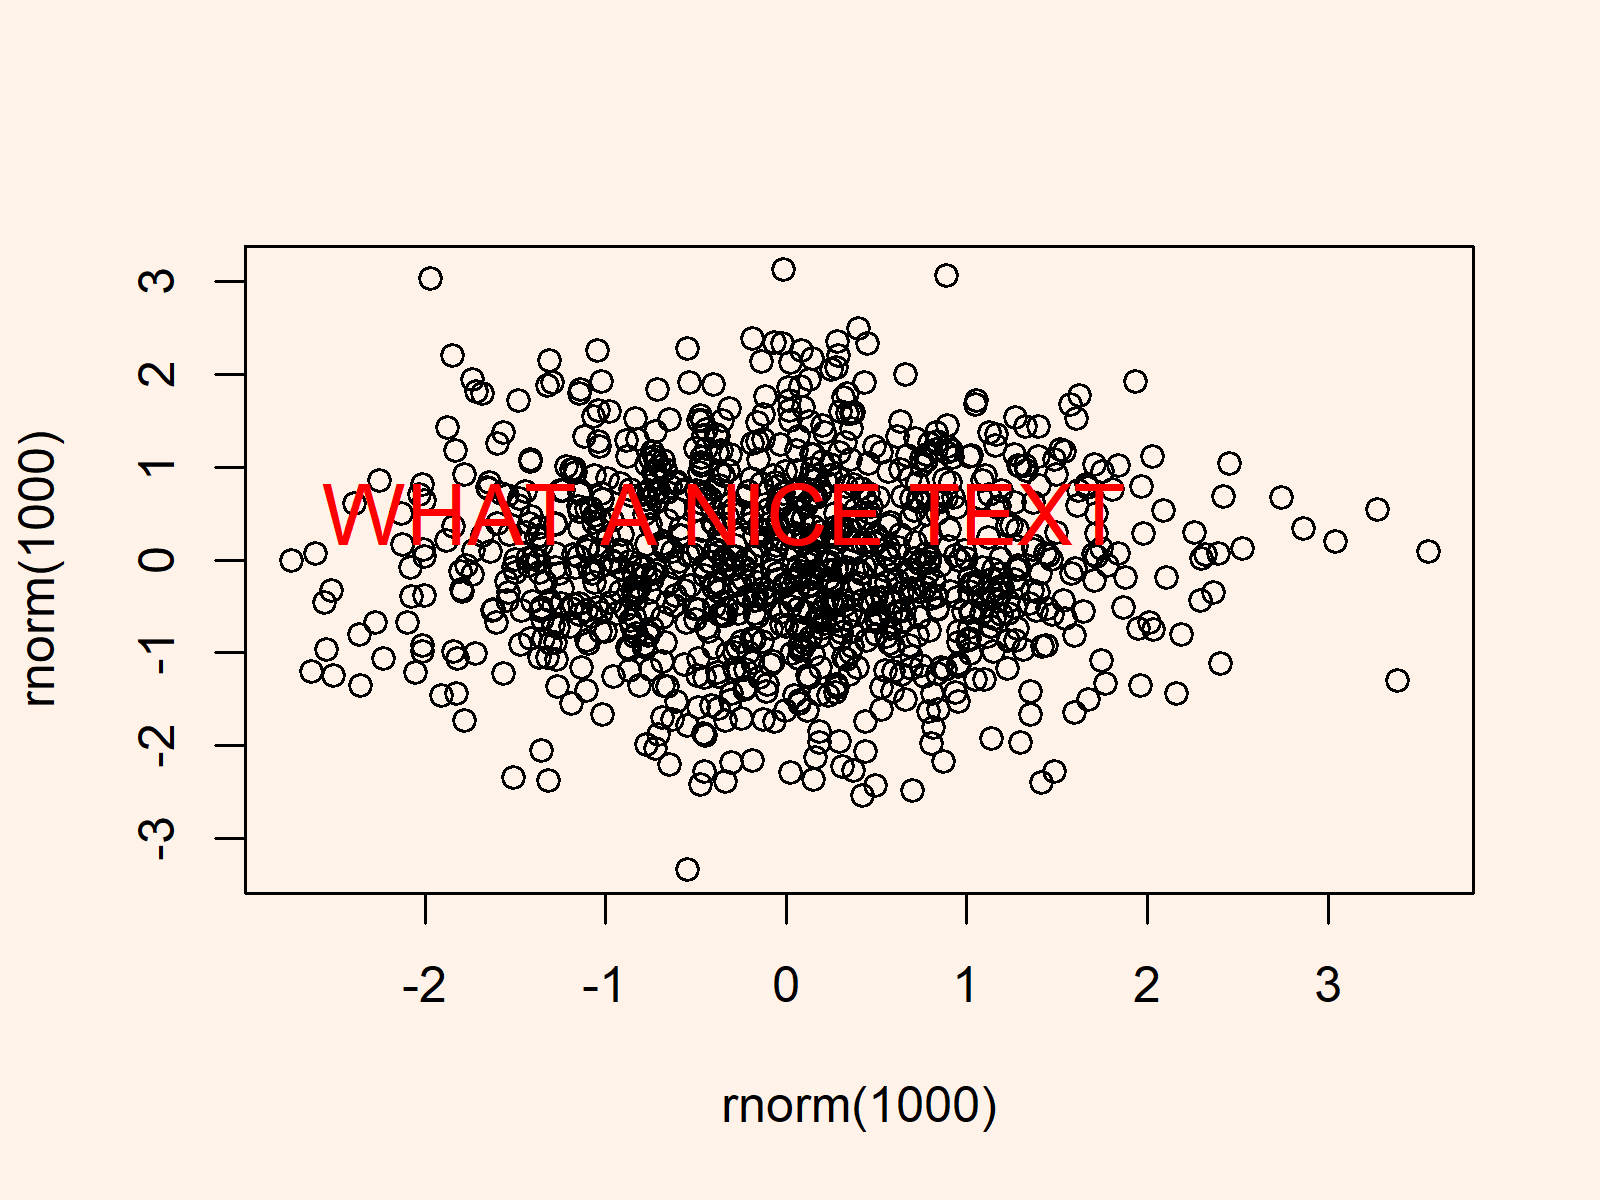
Example: Drawing Text to Graphic in R
set.seed(839754) # Create plot plot(rnorm(1000), rnorm(1000)) text(x = - 0.35, # Add text to plot y = 0.5, "WHAT A NICE TEXT", col = "red", cex = 1.7) |
set.seed(839754) # Create plot plot(rnorm(1000), rnorm(1000)) text(x = - 0.35, # Add text to plot y = 0.5, "WHAT A NICE TEXT", col = "red", cex = 1.7)

