How to Apply the par() Function in R (3 Examples)
In this article you’ll learn how to apply the par function in R programming.
Creation of Example Data
data(iris) # Load iris data set head(iris) # Sepal.Length Sepal.Width Petal.Length Petal.Width Species # 1 5.1 3.5 1.4 0.2 setosa # 2 4.9 3.0 1.4 0.2 setosa # 3 4.7 3.2 1.3 0.2 setosa # 4 4.6 3.1 1.5 0.2 setosa # 5 5.0 3.6 1.4 0.2 setosa # 6 5.4 3.9 1.7 0.4 setosa |
data(iris) # Load iris data set head(iris) # Sepal.Length Sepal.Width Petal.Length Petal.Width Species # 1 5.1 3.5 1.4 0.2 setosa # 2 4.9 3.0 1.4 0.2 setosa # 3 4.7 3.2 1.3 0.2 setosa # 4 4.6 3.1 1.5 0.2 setosa # 5 5.0 3.6 1.4 0.2 setosa # 6 5.4 3.9 1.7 0.4 setosa
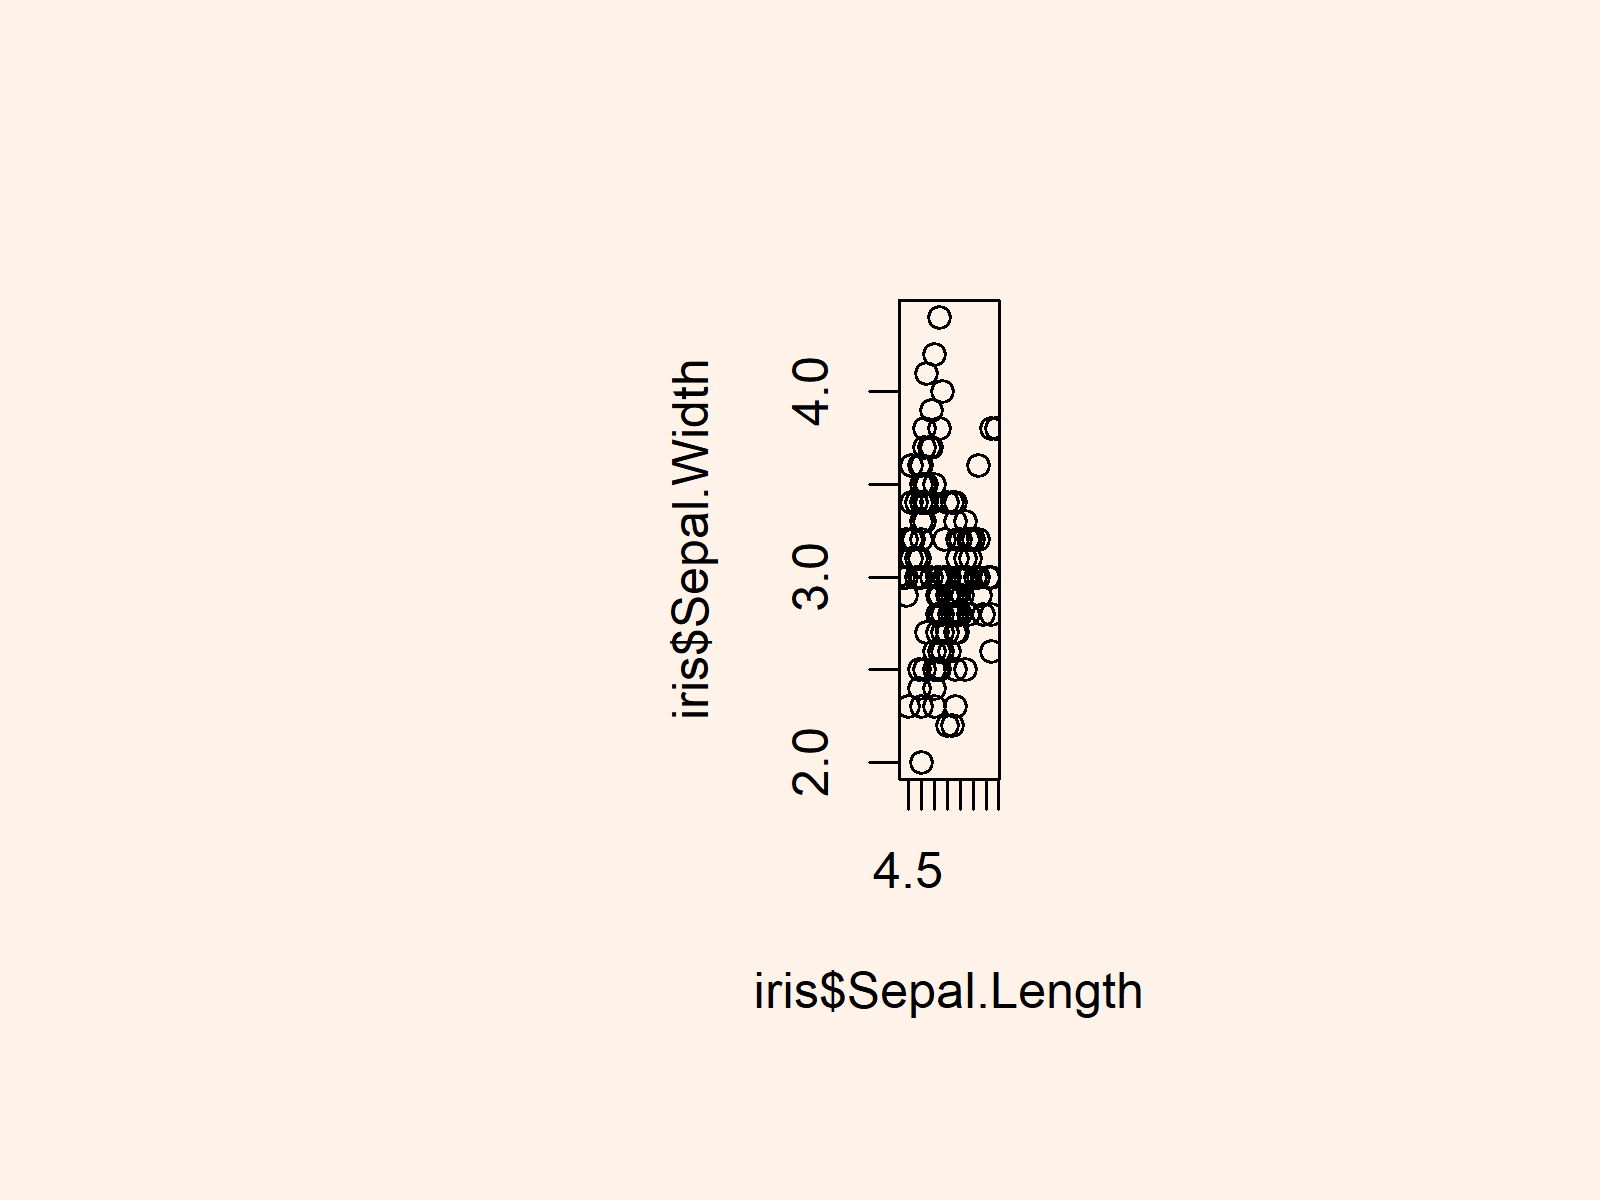
Example 1: Adjusting White Space Arround Graphic
par(mar = c(7, 15, 5, 10)) # Modifying white space |
par(mar = c(7, 15, 5, 10)) # Modifying white space
plot(iris$Sepal.Length, # Creating plot of iris iris$Sepal.Width) |
plot(iris$Sepal.Length, # Creating plot of iris iris$Sepal.Width)

dev.off() # Default specifications |
dev.off() # Default specifications
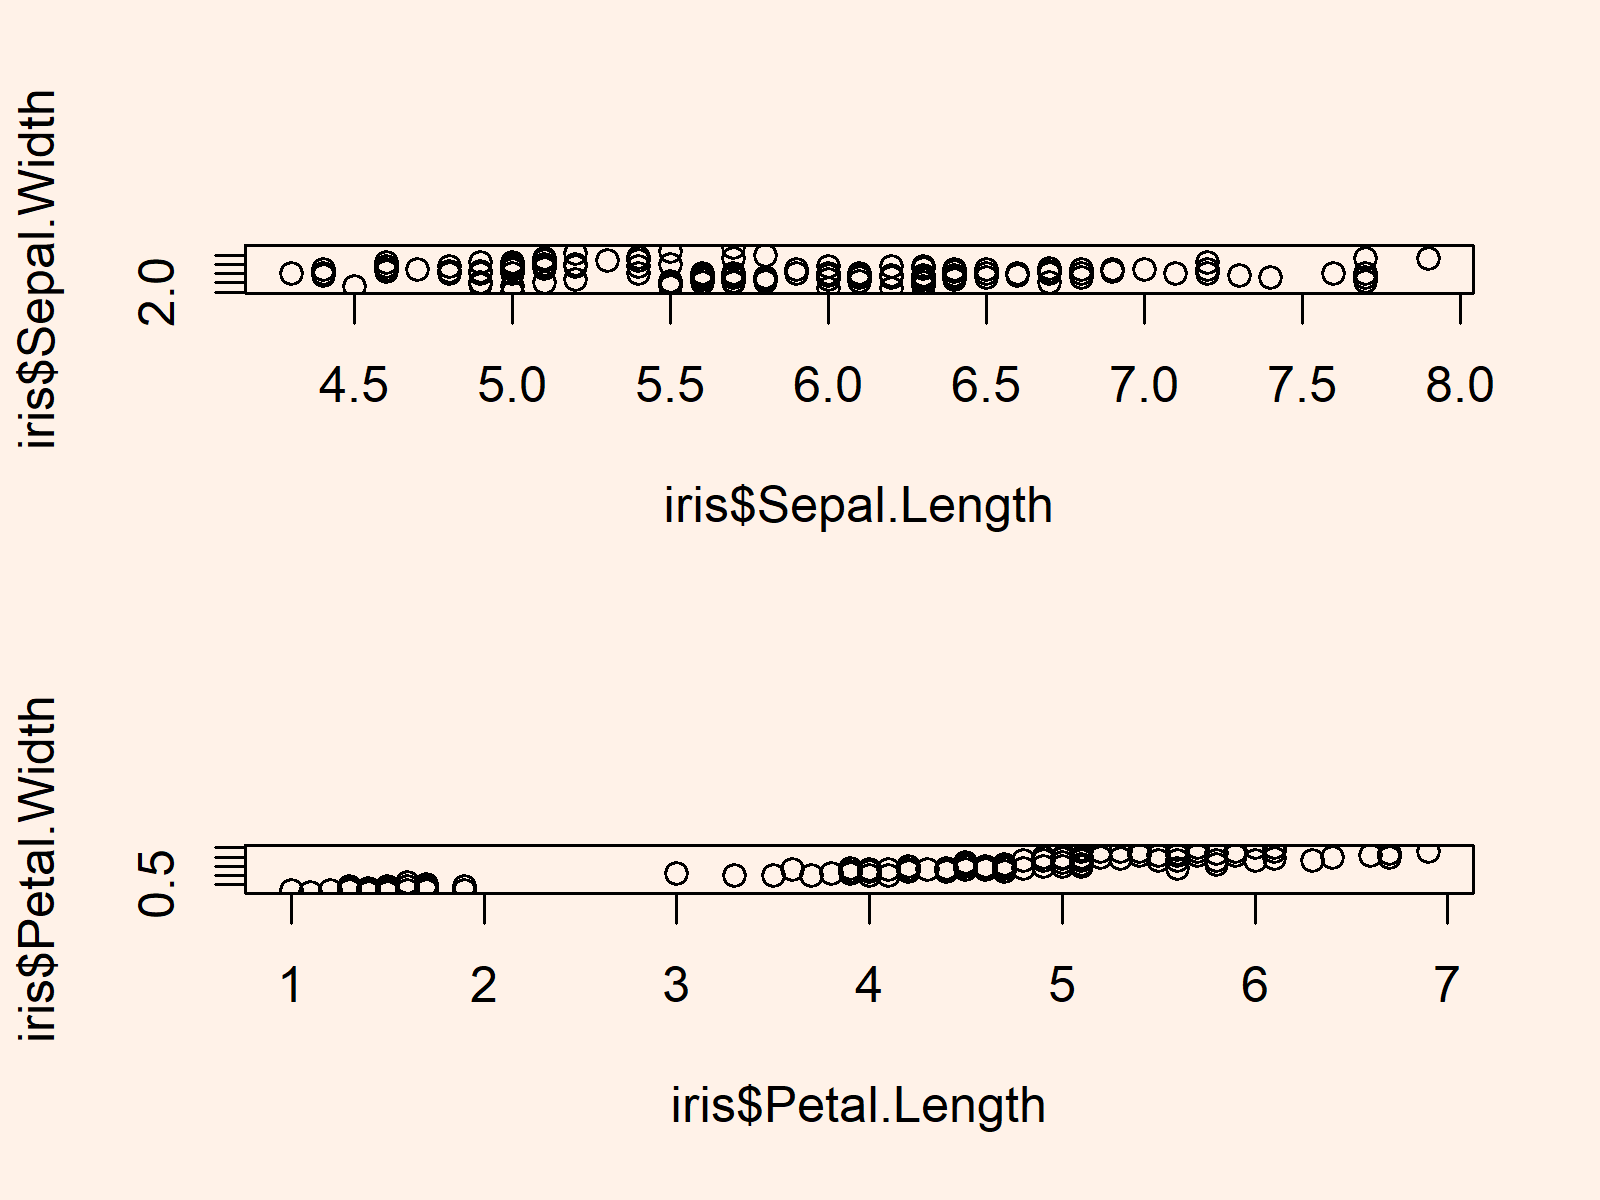
Example 2: Using par to Draw Graph Containing Multiple Plots
par(mfrow = c(2, 1)) # Specify par to create multiple plots |
par(mfrow = c(2, 1)) # Specify par to create multiple plots
plot(iris$Sepal.Length, # Creating plot of iris iris$Sepal.Width) plot(iris$Petal.Length, # Creating second plot iris$Petal.Width) |
plot(iris$Sepal.Length, # Creating plot of iris iris$Sepal.Width) plot(iris$Petal.Length, # Creating second plot iris$Petal.Width)

dev.off() # Default specifications |
dev.off() # Default specifications
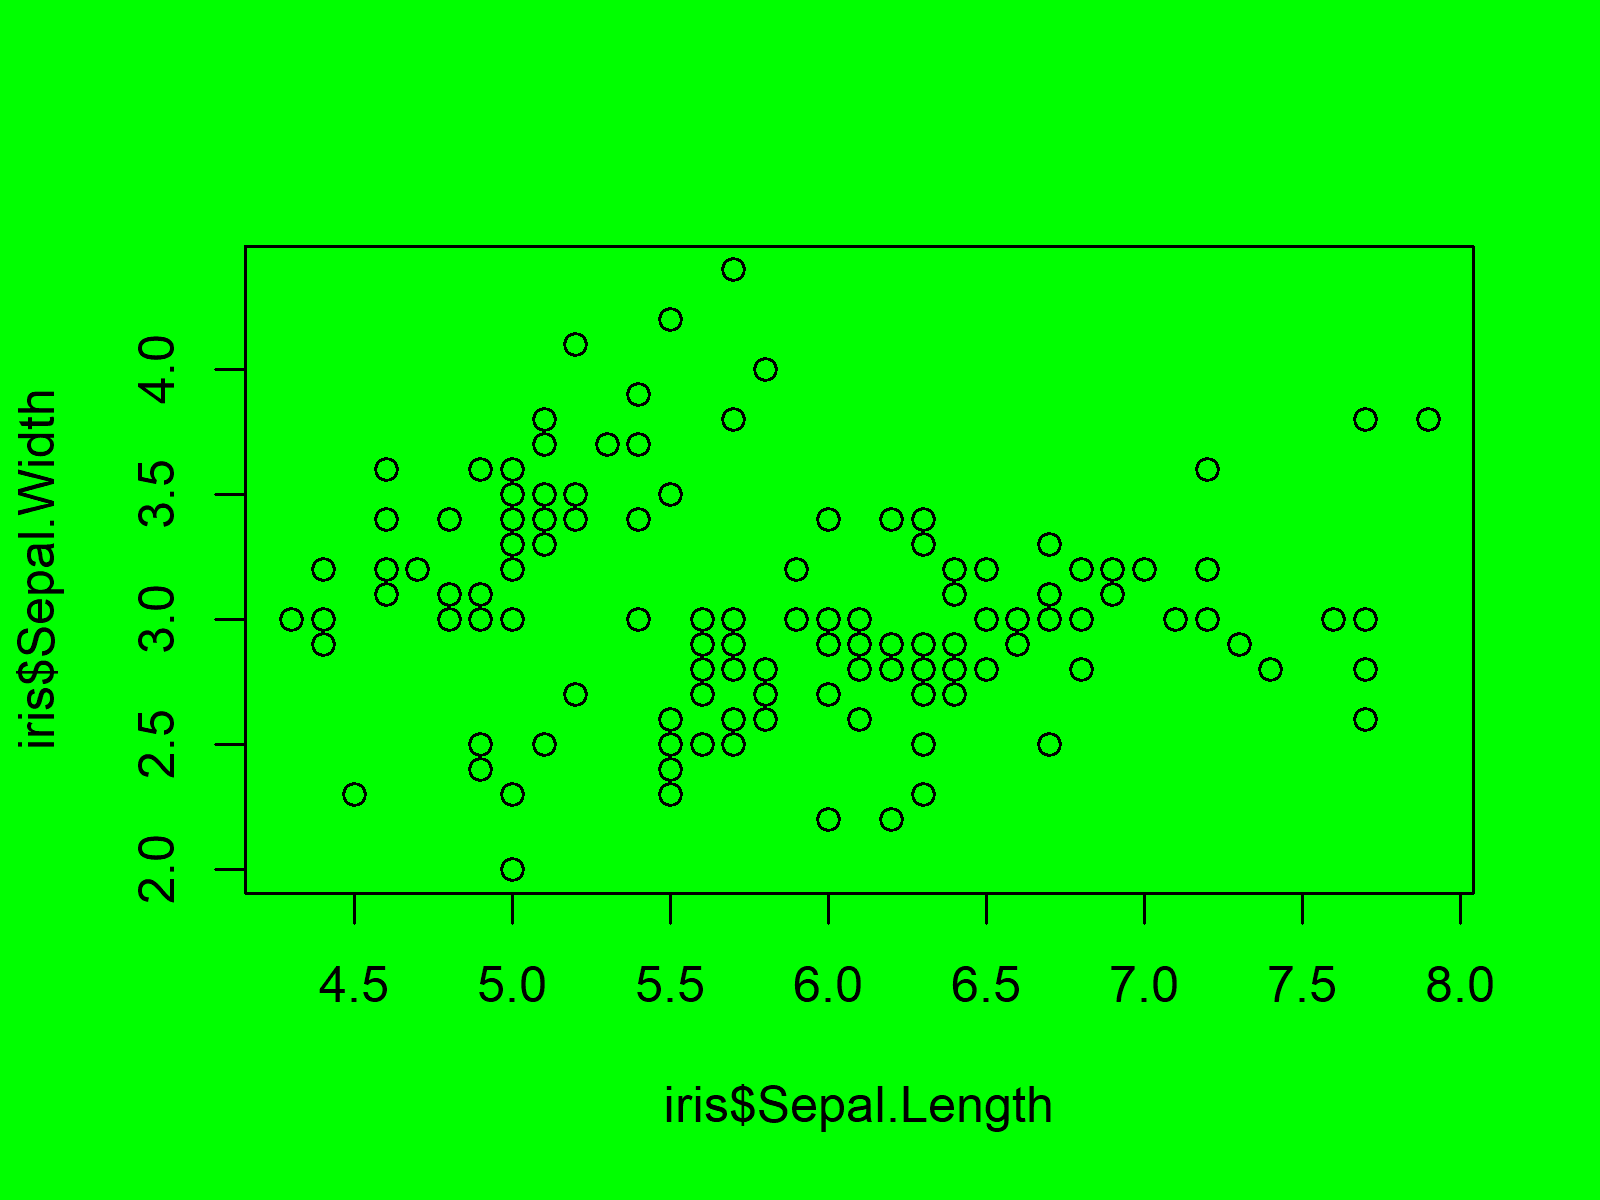
Example 3: Modifying Background Color of Graphic Using par()
par(bg = "green") # Changing background color to green |
par(bg = "green") # Changing background color to green
plot(iris$Sepal.Length, # Creating plot of iris iris$Sepal.Width) |
plot(iris$Sepal.Length, # Creating plot of iris iris$Sepal.Width)

dev.off() # Default specifications |
dev.off() # Default specifications
