Heatmap without Ordering & Dendrogram in R (Example Code)
This tutorial shows how to sort the rows and columns of a heatmap in the R programming language.
Example Data
set.seed(23673243) # Construct random example matrix example_matrix <- matrix(rnorm(50), ncol = 10) colnames(example_matrix) <- paste0("C", 1:10) rownames(example_matrix) <- paste0("R", 1:5) example_matrix # Display example matrix in RStudio console # C1 C2 C3 C4 C5 C6 C7 C8 C9 C10 # R1 -0.008725048 0.3725855 -1.0827395 1.2406760 -0.46382089 0.4793985 -0.65945509 -1.5785937 0.7905058 1.9223815 # R2 0.318856505 -0.3929117 0.9343610 0.1806054 1.13013821 0.5393940 -0.65393167 -0.7873401 0.5758661 0.3018941 # R3 0.251207798 1.3247435 1.1276704 -0.7016554 0.07780480 -0.6584143 -1.05583573 2.9129036 -0.3139361 -0.3263353 # R4 0.324973101 -0.5448206 -0.6481006 0.8660656 1.42093332 -0.3044779 -0.07168465 -0.2507589 -0.2781471 -0.8552507 # R5 0.315762988 3.0912964 0.3534547 0.5140224 -0.07689986 0.2624108 -0.11313905 -1.3839038 1.2416787 -0.9182486 |
set.seed(23673243) # Construct random example matrix example_matrix <- matrix(rnorm(50), ncol = 10) colnames(example_matrix) <- paste0("C", 1:10) rownames(example_matrix) <- paste0("R", 1:5) example_matrix # Display example matrix in RStudio console # C1 C2 C3 C4 C5 C6 C7 C8 C9 C10 # R1 -0.008725048 0.3725855 -1.0827395 1.2406760 -0.46382089 0.4793985 -0.65945509 -1.5785937 0.7905058 1.9223815 # R2 0.318856505 -0.3929117 0.9343610 0.1806054 1.13013821 0.5393940 -0.65393167 -0.7873401 0.5758661 0.3018941 # R3 0.251207798 1.3247435 1.1276704 -0.7016554 0.07780480 -0.6584143 -1.05583573 2.9129036 -0.3139361 -0.3263353 # R4 0.324973101 -0.5448206 -0.6481006 0.8660656 1.42093332 -0.3044779 -0.07168465 -0.2507589 -0.2781471 -0.8552507 # R5 0.315762988 3.0912964 0.3534547 0.5140224 -0.07689986 0.2624108 -0.11313905 -1.3839038 1.2416787 -0.9182486
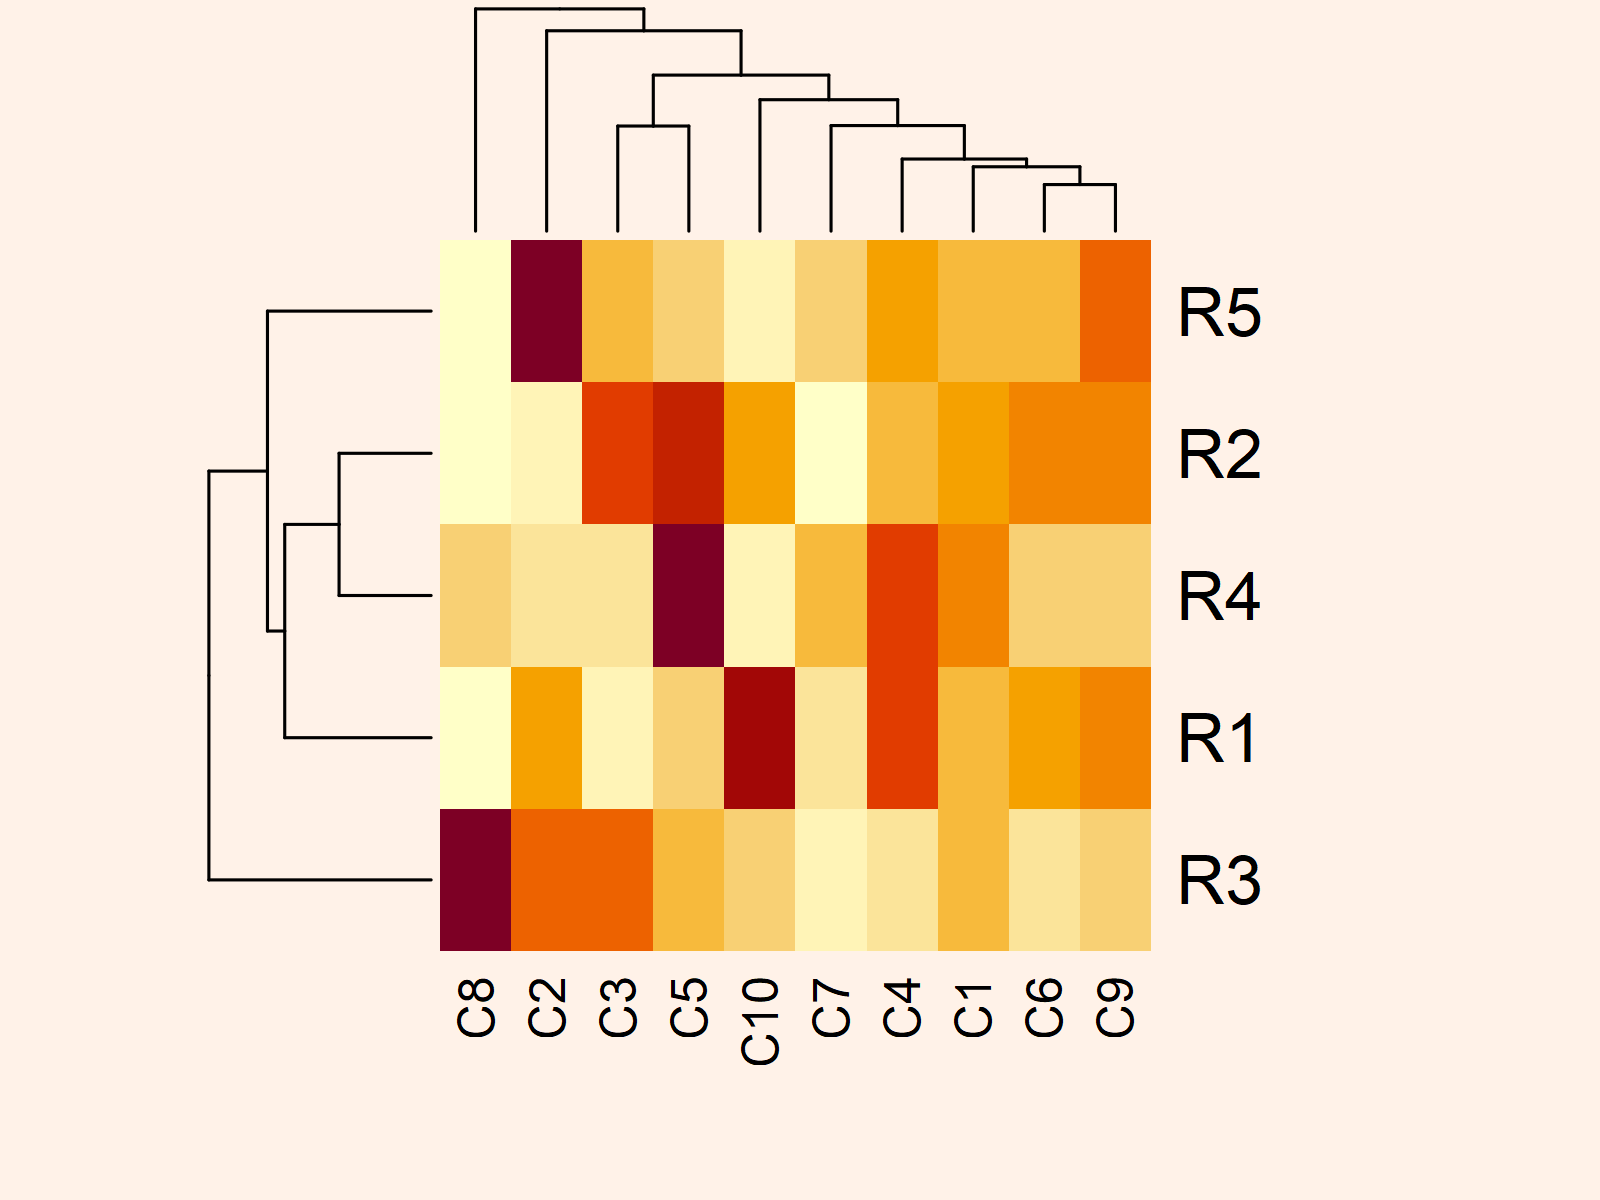
heatmap(example_matrix) # Draw default heatmap |
heatmap(example_matrix) # Draw default heatmap

Example: Remove Dendograms & Avoid Reordering
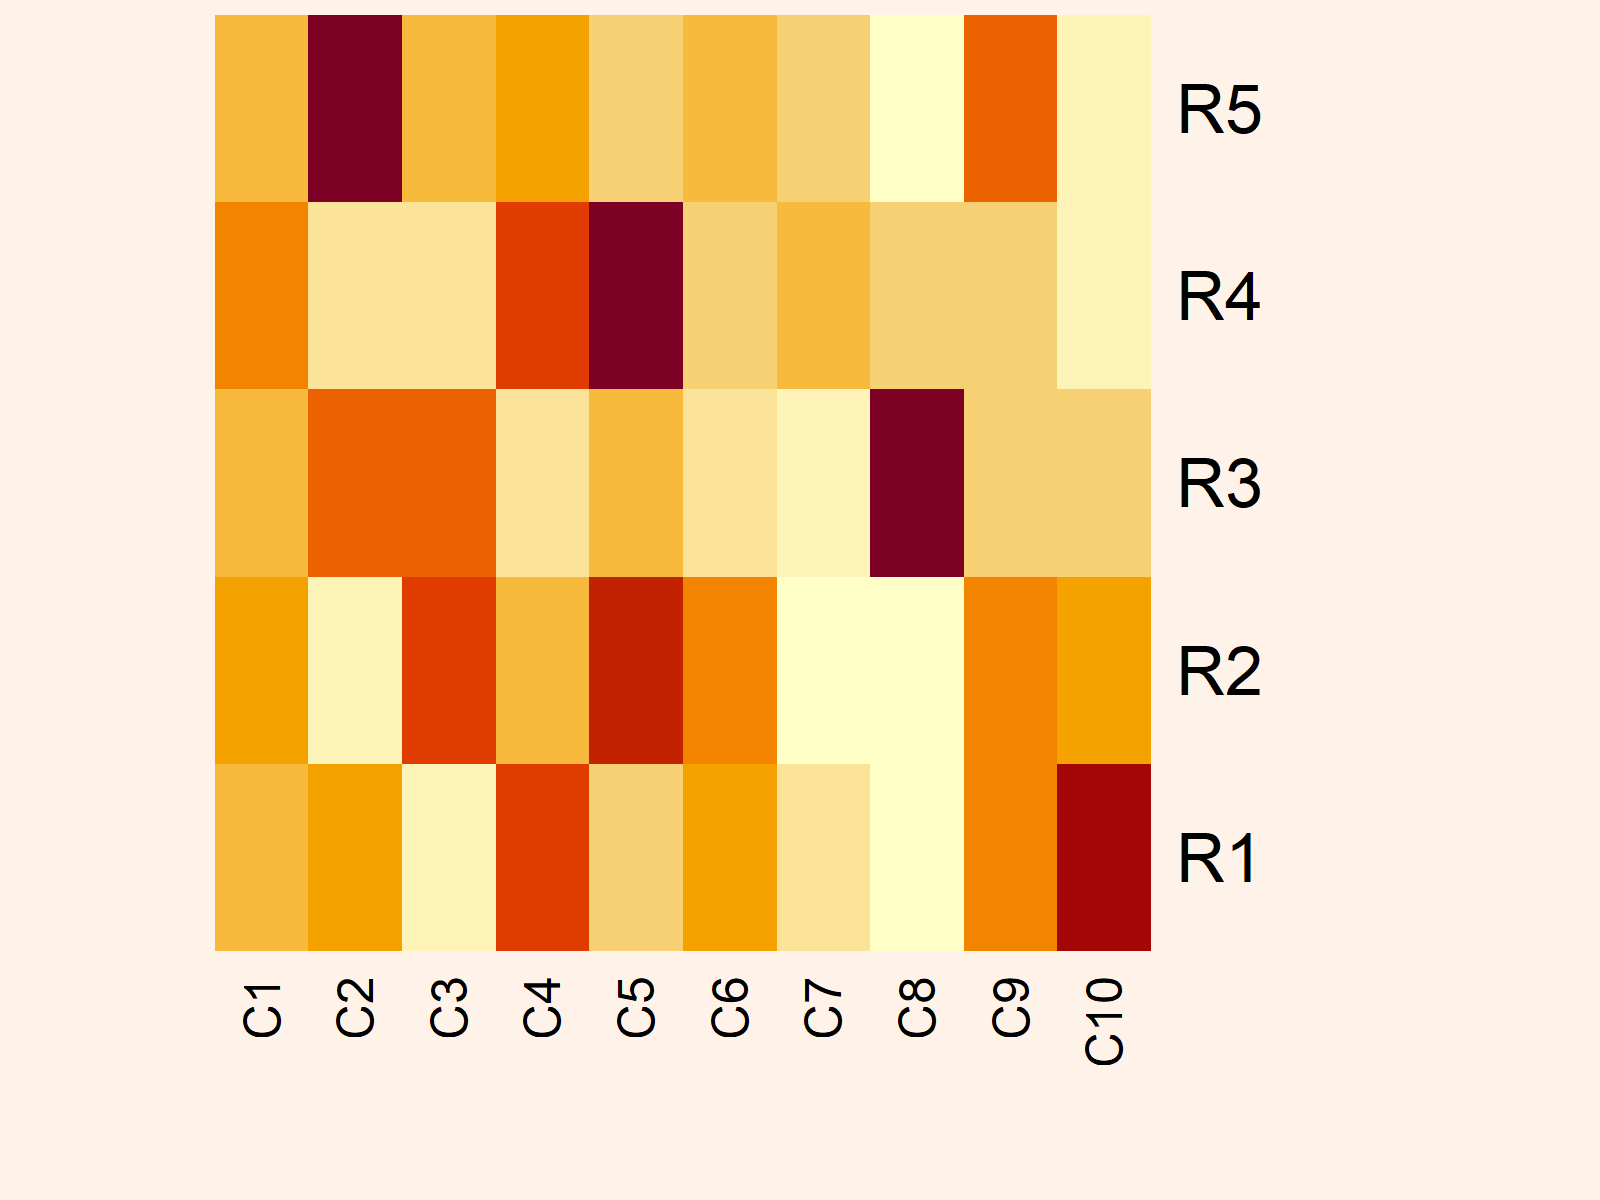
heatmap(example_matrix, # Heatmap with order as in matrix Rowv = NA, Colv = NA) |
heatmap(example_matrix, # Heatmap with order as in matrix Rowv = NA, Colv = NA)

Further Resources & Related Tutorials
Please find some further R programming tutorials on topics such as variables and dplyr below.
