Grid of Plots with Shared Main Title in R (2 Examples)
In this R tutorial you’ll learn how to create a graphic containing multiple plots and a common title.
Setting up the Examples
data(iris) # Loading example data head(iris) # Head of example data # Sepal.Length Sepal.Width Petal.Length Petal.Width Species # 1 5.1 3.5 1.4 0.2 setosa # 2 4.9 3.0 1.4 0.2 setosa # 3 4.7 3.2 1.3 0.2 setosa # 4 4.6 3.1 1.5 0.2 setosa # 5 5.0 3.6 1.4 0.2 setosa # 6 5.4 3.9 1.7 0.4 setosa |
data(iris) # Loading example data head(iris) # Head of example data # Sepal.Length Sepal.Width Petal.Length Petal.Width Species # 1 5.1 3.5 1.4 0.2 setosa # 2 4.9 3.0 1.4 0.2 setosa # 3 4.7 3.2 1.3 0.2 setosa # 4 4.6 3.1 1.5 0.2 setosa # 5 5.0 3.6 1.4 0.2 setosa # 6 5.4 3.9 1.7 0.4 setosa
Example 1: Create Grid of Plots with Shared Main Title in Base R
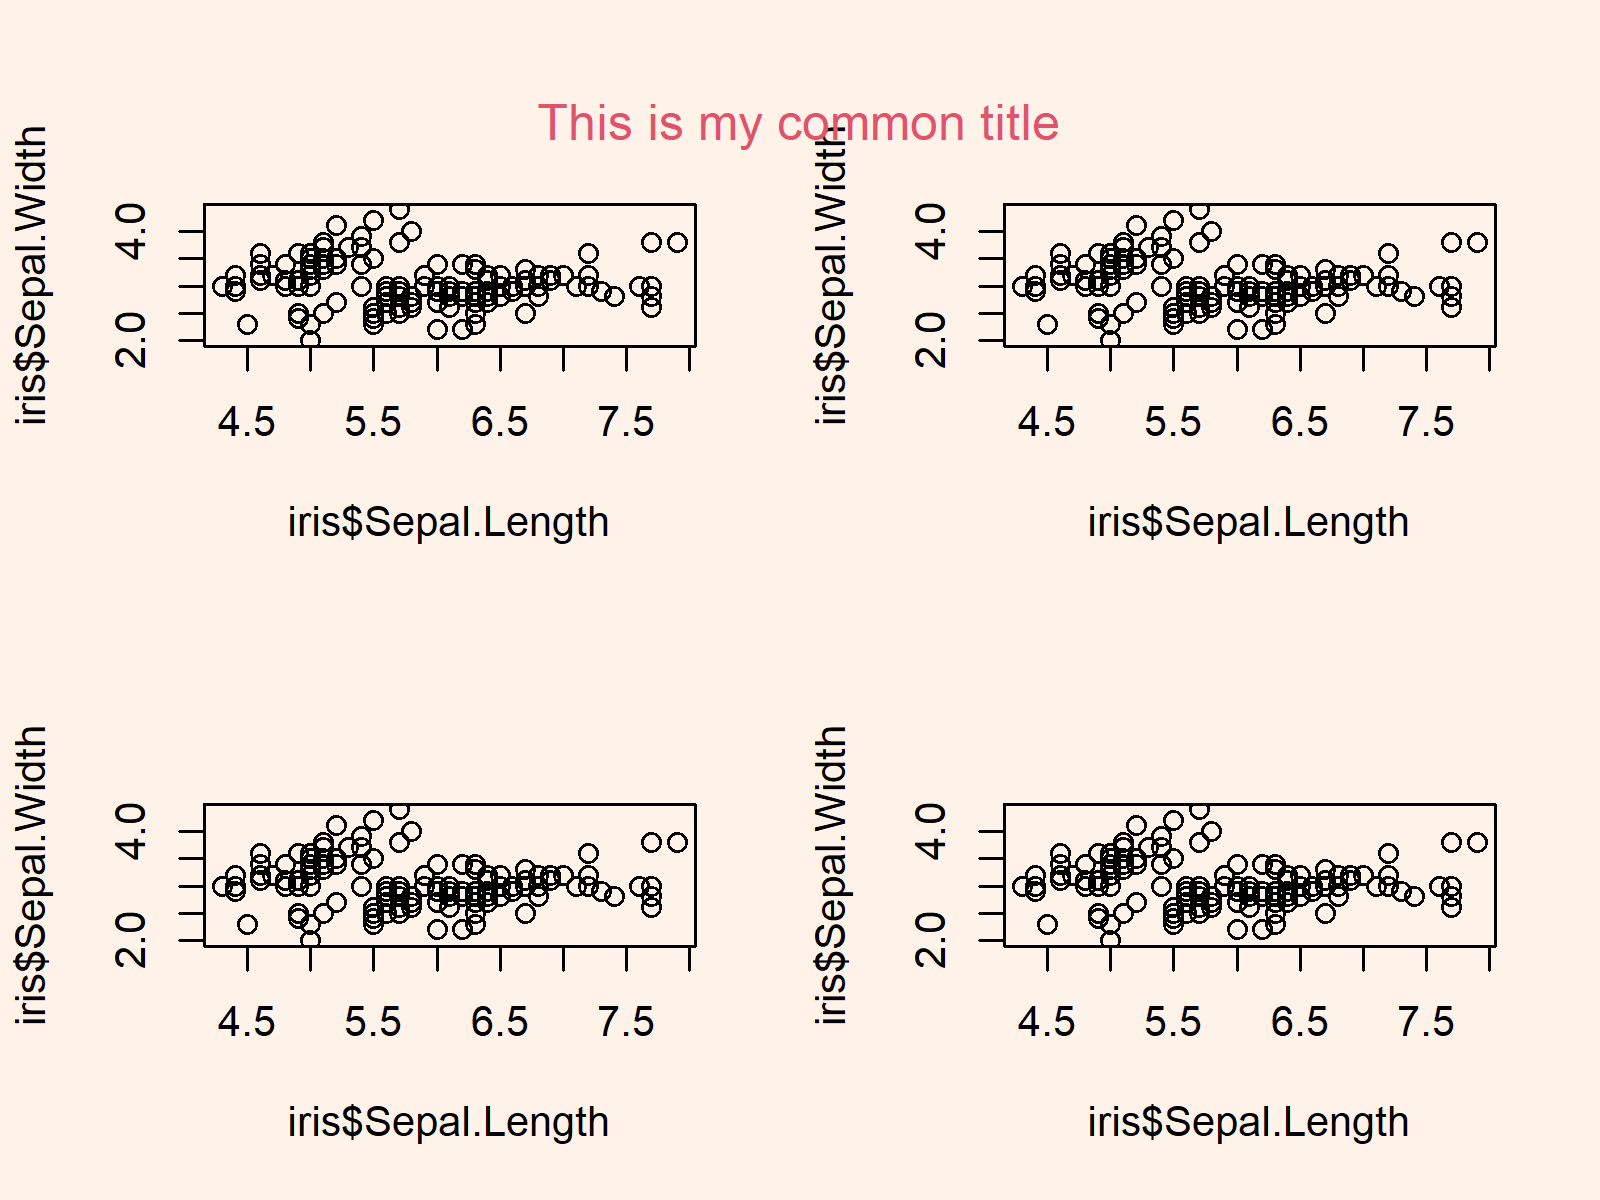
par(mfrow = c(2, 2)) # Creating grid of plots plot(iris$Sepal.Length, iris$Sepal.Width) plot(iris$Sepal.Length, iris$Sepal.Width) plot(iris$Sepal.Length, iris$Sepal.Width) plot(iris$Sepal.Length, iris$Sepal.Width) mtext("This is my common title", side = 3, line = - 3, outer = TRUE, col = 2) |
par(mfrow = c(2, 2)) # Creating grid of plots plot(iris$Sepal.Length, iris$Sepal.Width) plot(iris$Sepal.Length, iris$Sepal.Width) plot(iris$Sepal.Length, iris$Sepal.Width) plot(iris$Sepal.Length, iris$Sepal.Width) mtext("This is my common title", side = 3, line = - 3, outer = TRUE, col = 2)

Example 2: Create Grid of Plots with Shared Main Title in ggplot2
install.packages("ggplot2") # Install & load ggplot2 library("ggplot2") |
install.packages("ggplot2") # Install & load ggplot2 library("ggplot2")
install.packages("patchwork") # Install & load patchwork package library("patchwork") |
install.packages("patchwork") # Install & load patchwork package library("patchwork")
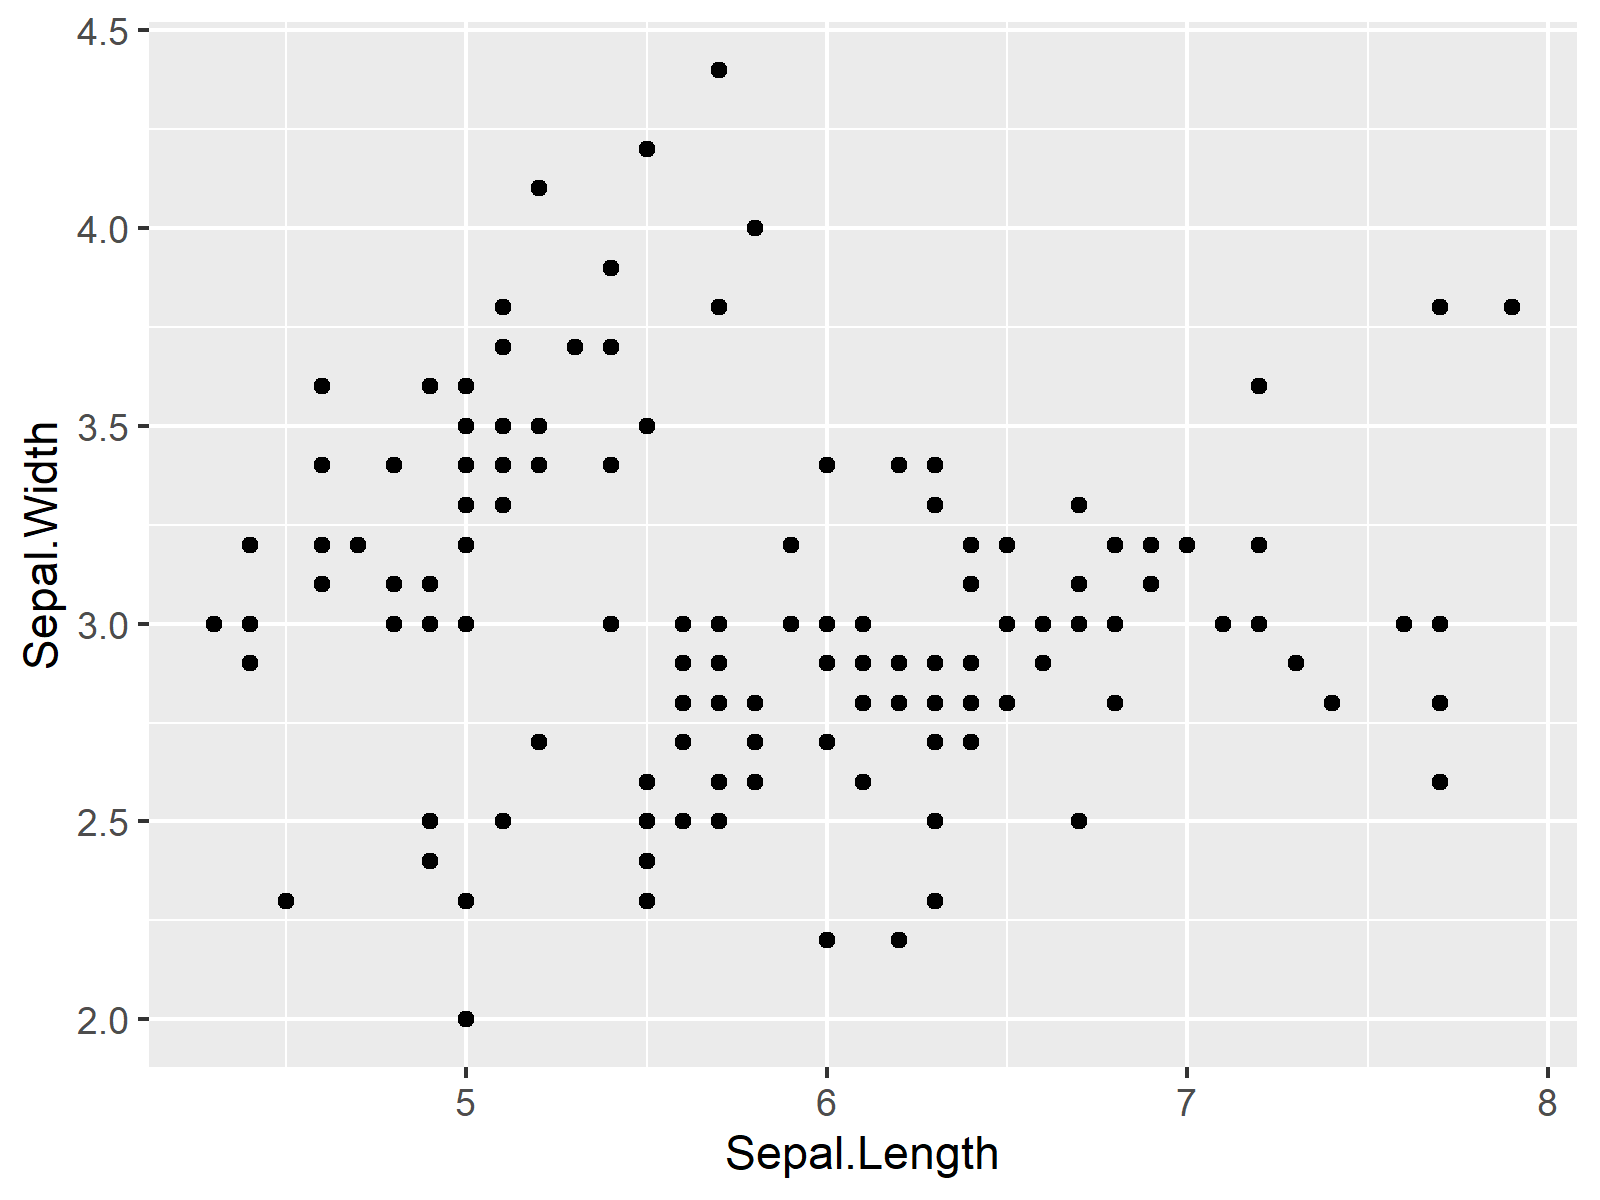
my_plot <- ggplot(iris, # Creating ggplot2 plot object aes(Sepal.Length, Sepal.Width)) + geom_point() |
my_plot <- ggplot(iris, # Creating ggplot2 plot object aes(Sepal.Length, Sepal.Width)) + geom_point()

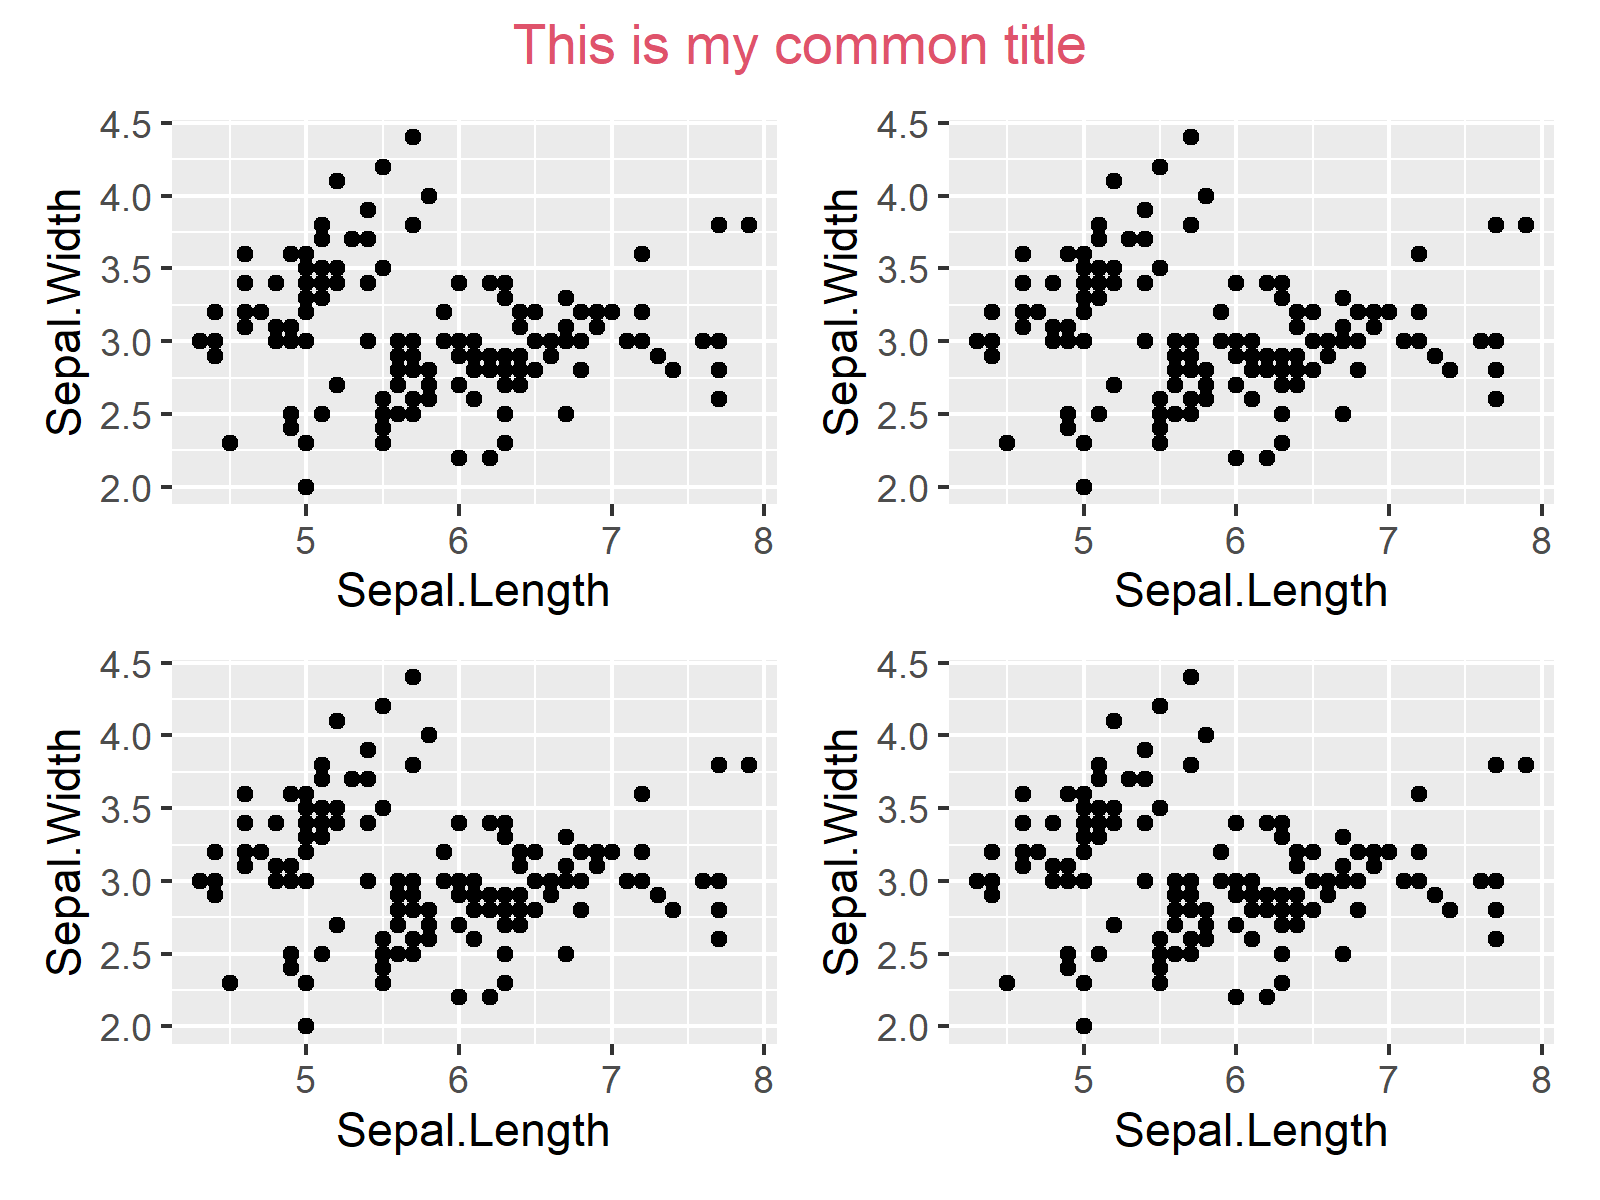
all_plots <- (my_plot + my_plot) / (my_plot + my_plot) + # Creating grid of plots plot_annotation(title = "This is my common title") & theme(plot.title = element_text(hjust = 0.5, color = 2)) all_plots |
all_plots <- (my_plot + my_plot) / (my_plot + my_plot) + # Creating grid of plots plot_annotation(title = "This is my common title") & theme(plot.title = element_text(hjust = 0.5, color = 2)) all_plots

