ggplot2 Facet Boxplot for Groups of Continuous Variable in R (Example Code)
On this page you’ll learn how to split a continuous variable into boxplot-groups in the R programming language.
Preparing the Example
data(iris) # Example data head(iris) # Sepal.Length Sepal.Width Petal.Length Petal.Width Species # 1 5.1 3.5 1.4 0.2 setosa # 2 4.9 3.0 1.4 0.2 setosa # 3 4.7 3.2 1.3 0.2 setosa # 4 4.6 3.1 1.5 0.2 setosa # 5 5.0 3.6 1.4 0.2 setosa # 6 5.4 3.9 1.7 0.4 setosa |
data(iris) # Example data head(iris) # Sepal.Length Sepal.Width Petal.Length Petal.Width Species # 1 5.1 3.5 1.4 0.2 setosa # 2 4.9 3.0 1.4 0.2 setosa # 3 4.7 3.2 1.3 0.2 setosa # 4 4.6 3.1 1.5 0.2 setosa # 5 5.0 3.6 1.4 0.2 setosa # 6 5.4 3.9 1.7 0.4 setosa
install.packages("ggplot2") # Install & load ggplot2 library("ggplot2") |
install.packages("ggplot2") # Install & load ggplot2 library("ggplot2")
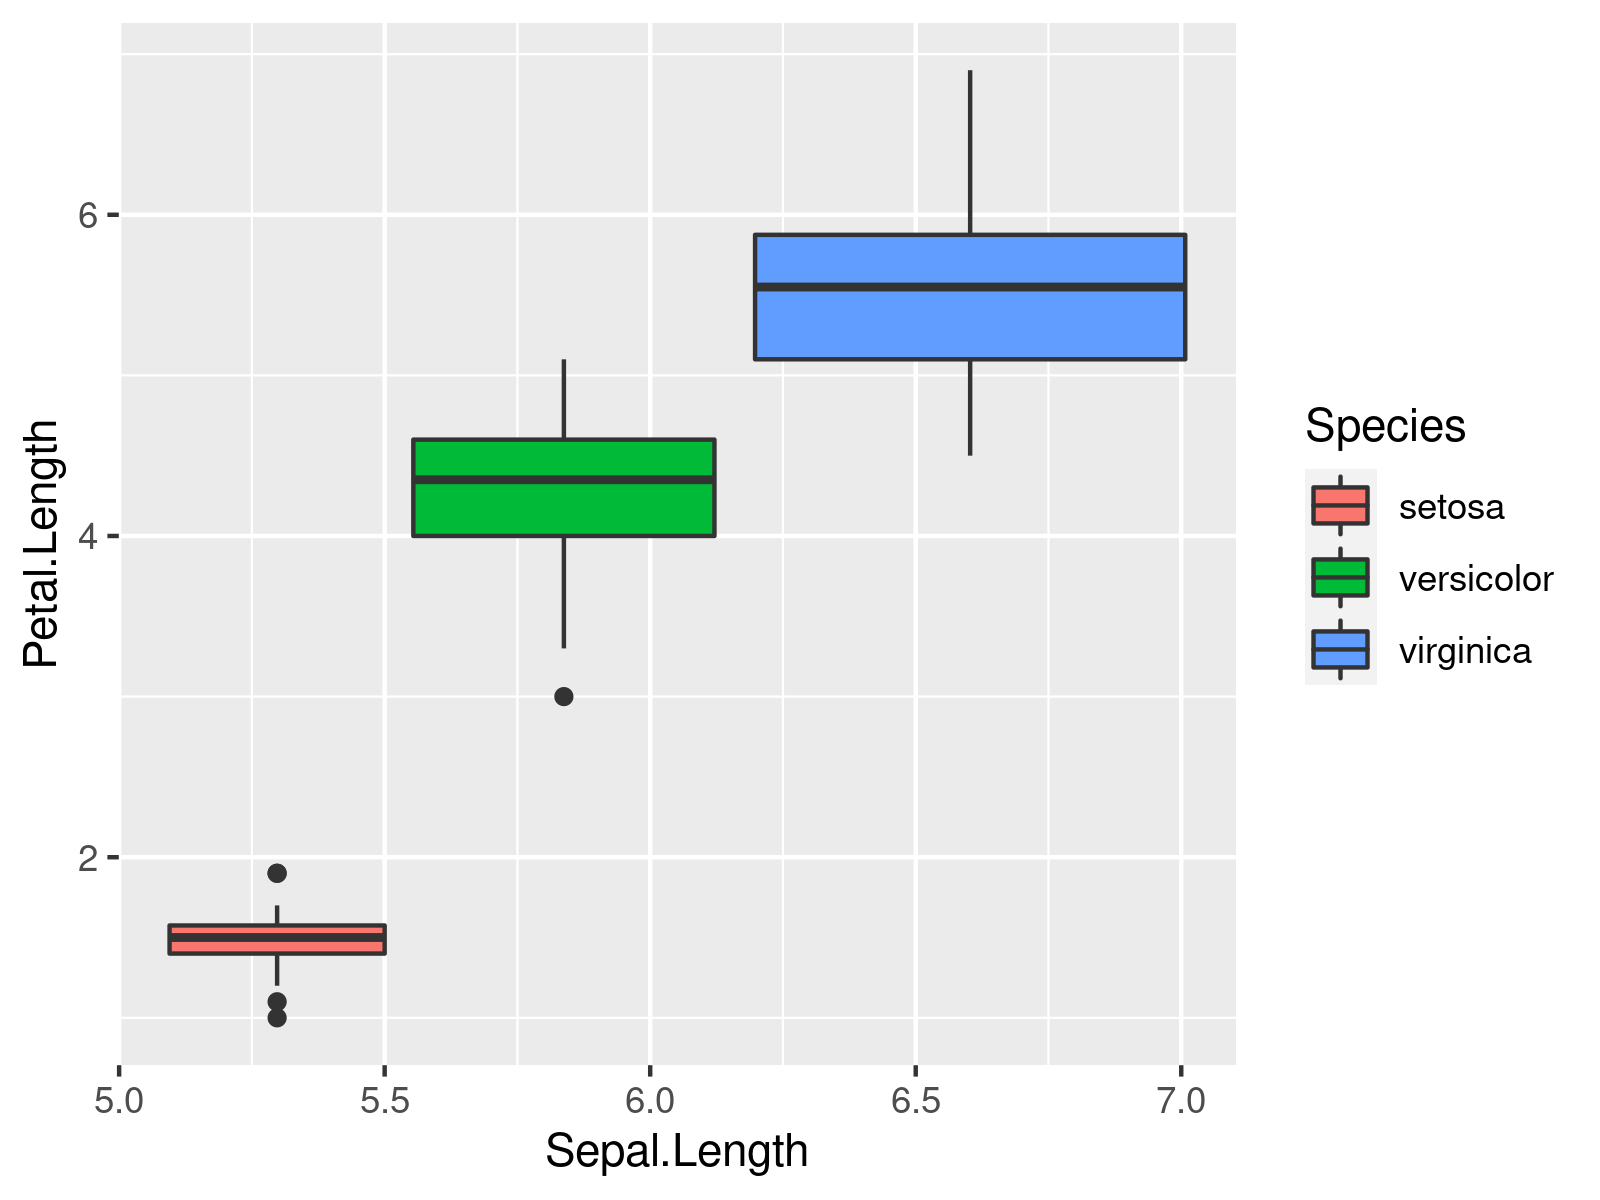
ggplot(iris, # Create ggplot2 boxplot aes(x = Sepal.Length, y = Petal.Length, fill = Species)) + geom_boxplot() |
ggplot(iris, # Create ggplot2 boxplot aes(x = Sepal.Length, y = Petal.Length, fill = Species)) + geom_boxplot()

Example: Cutting Continuous Variable into Groups in Boxplot
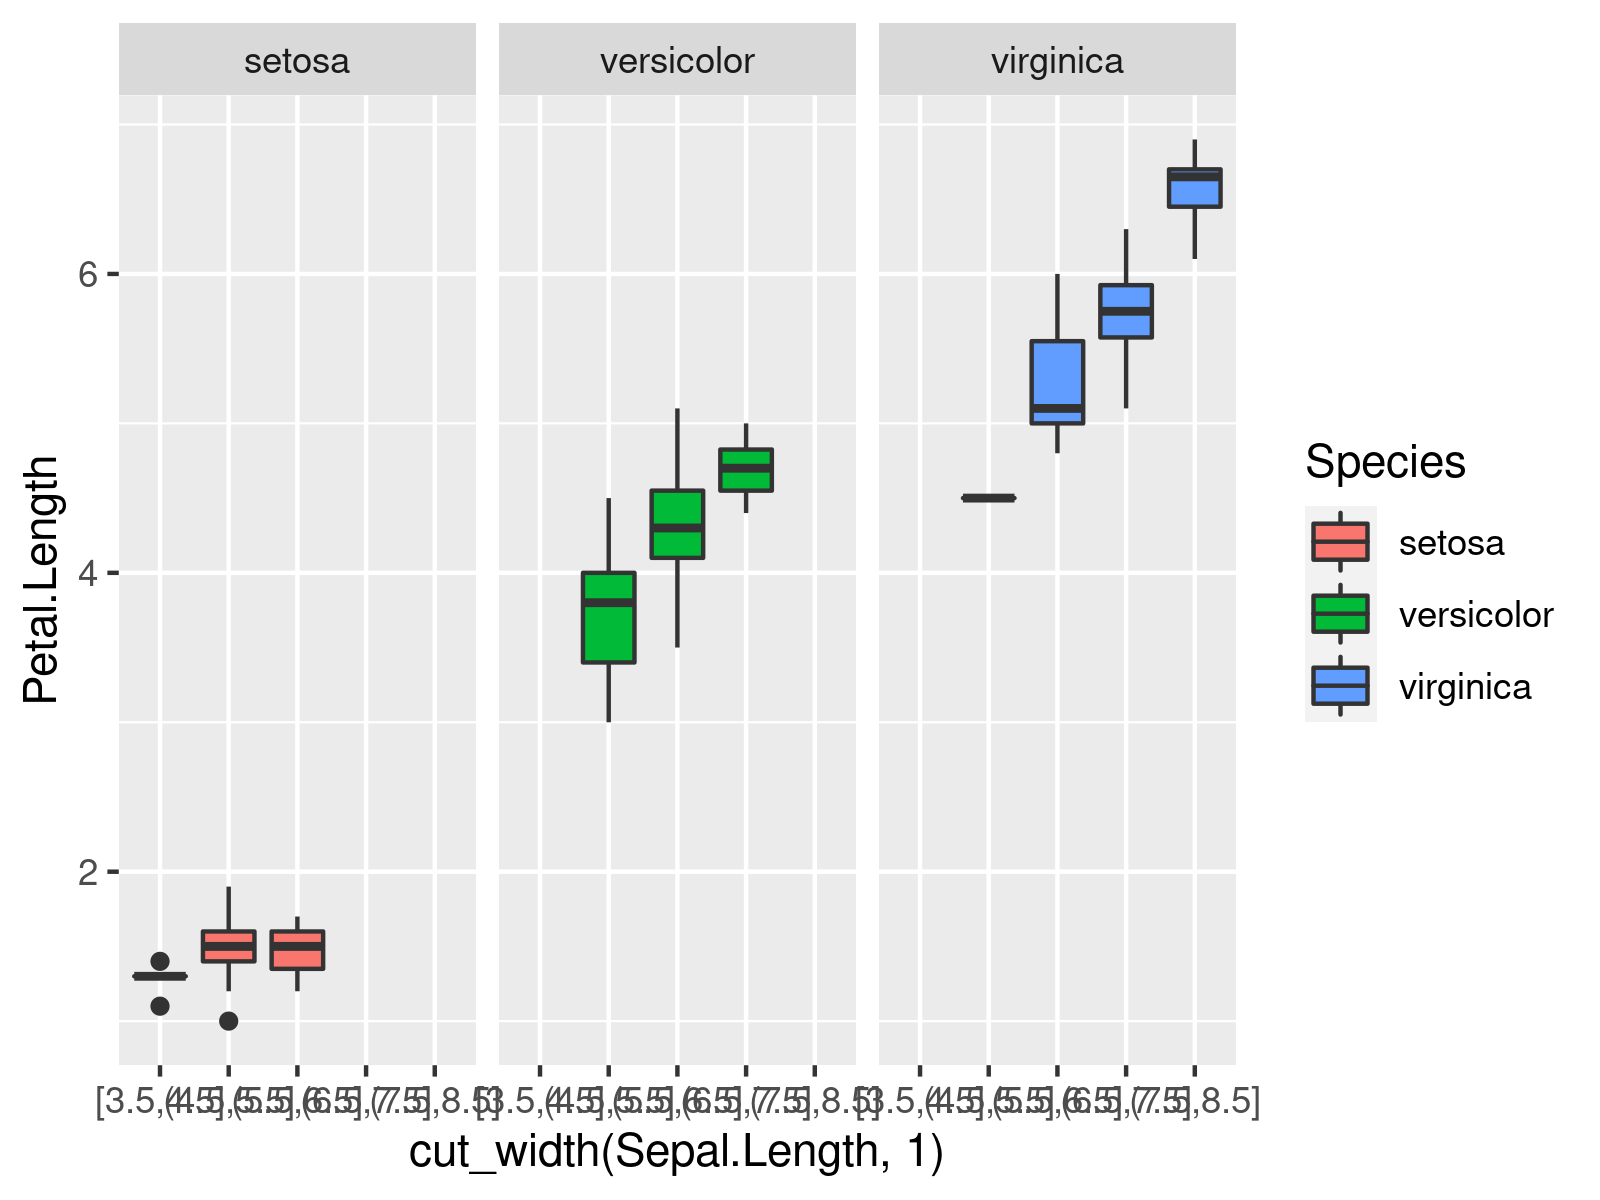
ggplot(iris, # ggplot2 boxplot with multiple groups aes(x = cut_width(Sepal.Length, 1), y = Petal.Length, fill = Species)) + geom_boxplot() + facet_grid(. ~ Species) |
ggplot(iris, # ggplot2 boxplot with multiple groups aes(x = cut_width(Sepal.Length, 1), y = Petal.Length, fill = Species)) + geom_boxplot() + facet_grid(. ~ Species)

