Draw a Raster Plot based on a Data Frame in R (Example Code)
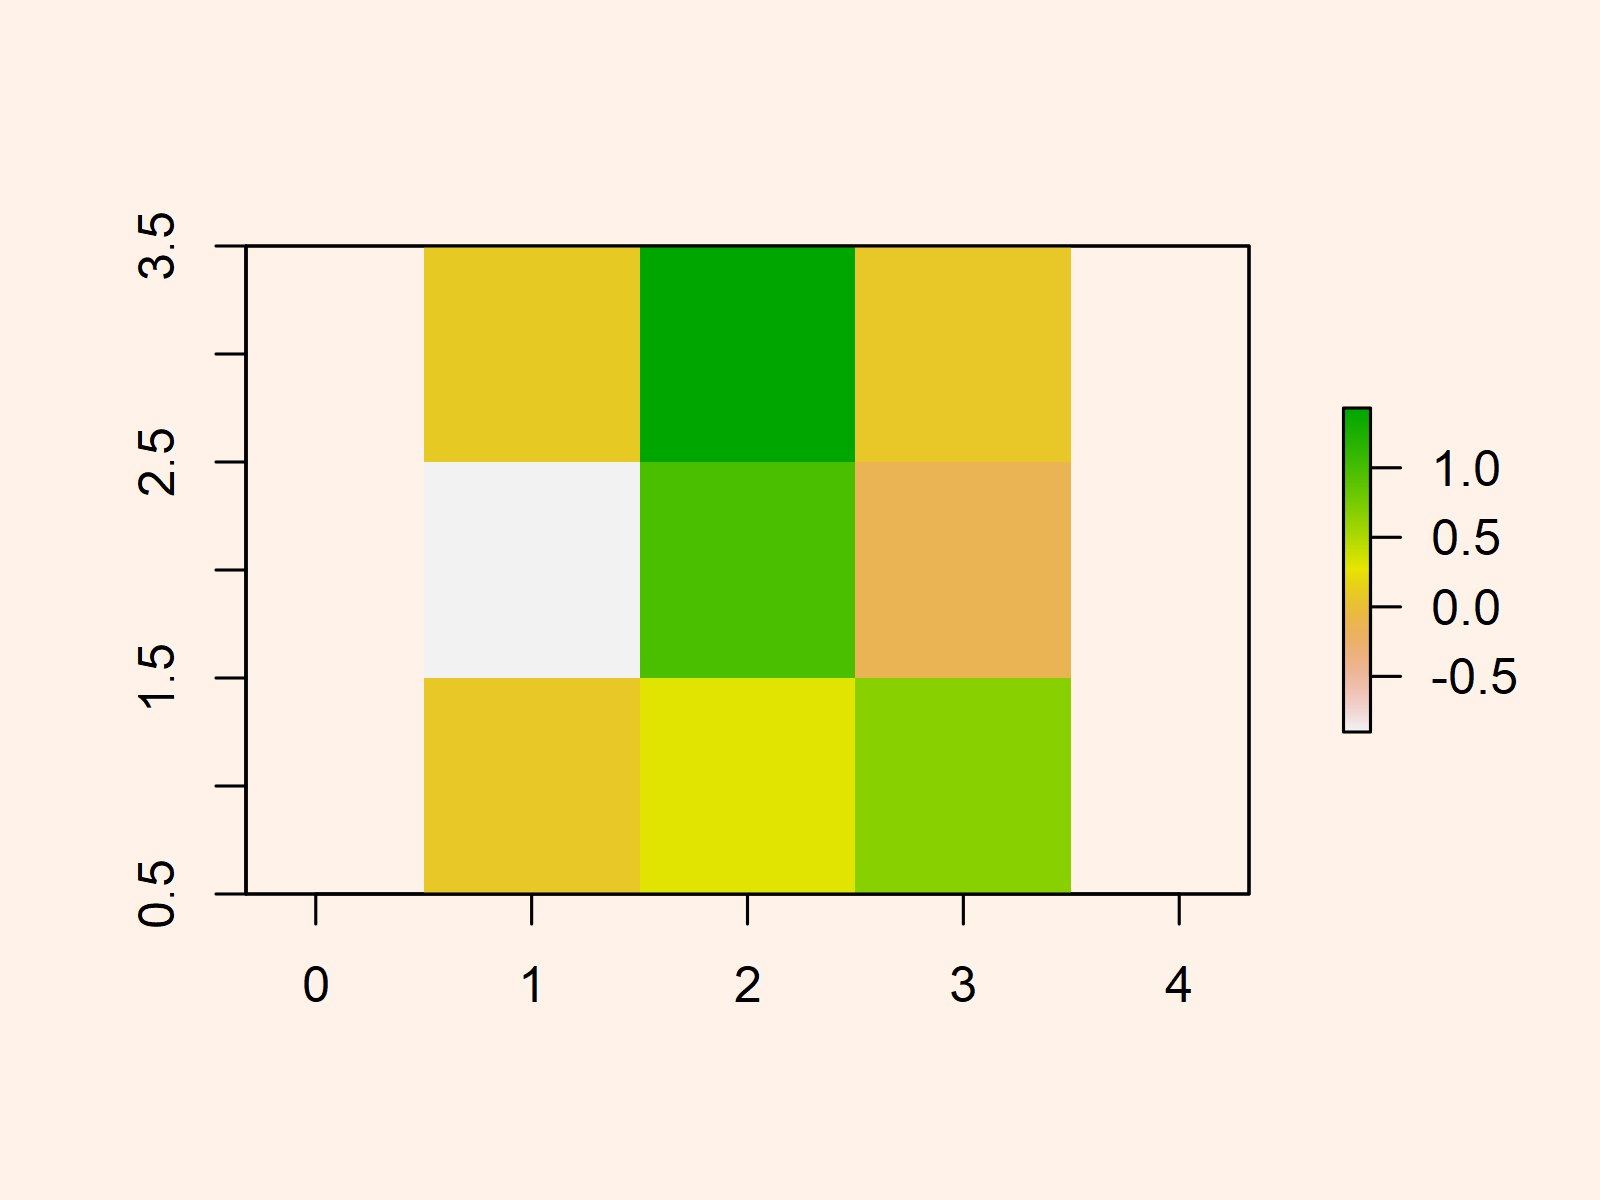
In this article, I’ll demonstrate how to transform a data frame to a raster graphic in R programming.
Creating Example Data
set.seed(3265343) # Creating example data df <- data.frame(x = rep(1:3, each = 3), y = rep(1:3, 3), z = round(rnorm(9), 2)) df # x y z # 1 1 1 0.08 # 2 1 2 -0.90 # 3 1 3 0.09 # 4 2 1 0.29 # 5 2 2 0.98 # 6 2 3 1.43 # 7 3 1 0.67 # 8 3 2 -0.15 # 9 3 3 0.07 |
set.seed(3265343) # Creating example data df <- data.frame(x = rep(1:3, each = 3), y = rep(1:3, 3), z = round(rnorm(9), 2)) df # x y z # 1 1 1 0.08 # 2 1 2 -0.90 # 3 1 3 0.09 # 4 2 1 0.29 # 5 2 2 0.98 # 6 2 3 1.43 # 7 3 1 0.67 # 8 3 2 -0.15 # 9 3 3 0.07
Example: Draw Raster from Data Frame Using rasterFromXYZ() Function of raster Package
install.packages("raster") # Install raster package library("raster") # Load raster package |
install.packages("raster") # Install raster package library("raster") # Load raster package
df_rst <- rasterFromXYZ(df) # Transforming data frame to raster |
df_rst <- rasterFromXYZ(df) # Transforming data frame to raster
plot(df_rst) # Creating a raster graph |
plot(df_rst) # Creating a raster graph

Further Resources & Related Articles
Below, you can find some further resources on topics such as graphics in R, data objects, variables, and ggplot2.
