How to Draw a Heatmap with Values in R (Example Code)
In this R tutorial you’ll learn how to draw a heatmap with values.
Preparing the Example
set.seed(56833) # Constructing example data my_df <- data.frame(Var1 = rep(paste0("Var1_Gr", 1:3), each = 8), Var2 = paste0("Var2_Gr", 1:8), Val = round(rnorm(24), 3)) my_df # Displaying example data # Var1 Var2 Val # 1 Var1_Gr1 Var2_Gr1 0.134 # 2 Var1_Gr1 Var2_Gr2 -0.342 # 3 Var1_Gr1 Var2_Gr3 -0.613 # 4 Var1_Gr1 Var2_Gr4 0.093 # 5 Var1_Gr1 Var2_Gr5 0.206 # 6 Var1_Gr1 Var2_Gr6 -1.593 # 7 Var1_Gr1 Var2_Gr7 0.156 # 8 Var1_Gr1 Var2_Gr8 0.628 # 9 Var1_Gr2 Var2_Gr1 0.417 # 10 Var1_Gr2 Var2_Gr2 -0.669 # 11 Var1_Gr2 Var2_Gr3 -1.245 # 12 Var1_Gr2 Var2_Gr4 0.439 # 13 Var1_Gr2 Var2_Gr5 0.796 # 14 Var1_Gr2 Var2_Gr6 -1.413 # 15 Var1_Gr2 Var2_Gr7 -0.462 # 16 Var1_Gr2 Var2_Gr8 -1.374 # 17 Var1_Gr3 Var2_Gr1 -0.901 # 18 Var1_Gr3 Var2_Gr2 1.112 # 19 Var1_Gr3 Var2_Gr3 0.120 # 20 Var1_Gr3 Var2_Gr4 0.089 # 21 Var1_Gr3 Var2_Gr5 -0.049 # 22 Var1_Gr3 Var2_Gr6 0.435 # 23 Var1_Gr3 Var2_Gr7 0.334 # 24 Var1_Gr3 Var2_Gr8 -0.454 |
set.seed(56833) # Constructing example data my_df <- data.frame(Var1 = rep(paste0("Var1_Gr", 1:3), each = 8), Var2 = paste0("Var2_Gr", 1:8), Val = round(rnorm(24), 3)) my_df # Displaying example data # Var1 Var2 Val # 1 Var1_Gr1 Var2_Gr1 0.134 # 2 Var1_Gr1 Var2_Gr2 -0.342 # 3 Var1_Gr1 Var2_Gr3 -0.613 # 4 Var1_Gr1 Var2_Gr4 0.093 # 5 Var1_Gr1 Var2_Gr5 0.206 # 6 Var1_Gr1 Var2_Gr6 -1.593 # 7 Var1_Gr1 Var2_Gr7 0.156 # 8 Var1_Gr1 Var2_Gr8 0.628 # 9 Var1_Gr2 Var2_Gr1 0.417 # 10 Var1_Gr2 Var2_Gr2 -0.669 # 11 Var1_Gr2 Var2_Gr3 -1.245 # 12 Var1_Gr2 Var2_Gr4 0.439 # 13 Var1_Gr2 Var2_Gr5 0.796 # 14 Var1_Gr2 Var2_Gr6 -1.413 # 15 Var1_Gr2 Var2_Gr7 -0.462 # 16 Var1_Gr2 Var2_Gr8 -1.374 # 17 Var1_Gr3 Var2_Gr1 -0.901 # 18 Var1_Gr3 Var2_Gr2 1.112 # 19 Var1_Gr3 Var2_Gr3 0.120 # 20 Var1_Gr3 Var2_Gr4 0.089 # 21 Var1_Gr3 Var2_Gr5 -0.049 # 22 Var1_Gr3 Var2_Gr6 0.435 # 23 Var1_Gr3 Var2_Gr7 0.334 # 24 Var1_Gr3 Var2_Gr8 -0.454
install.packages("ggplot2") # Install ggplot2 package library("ggplot2") # Load ggplot2 package |
install.packages("ggplot2") # Install ggplot2 package library("ggplot2") # Load ggplot2 package
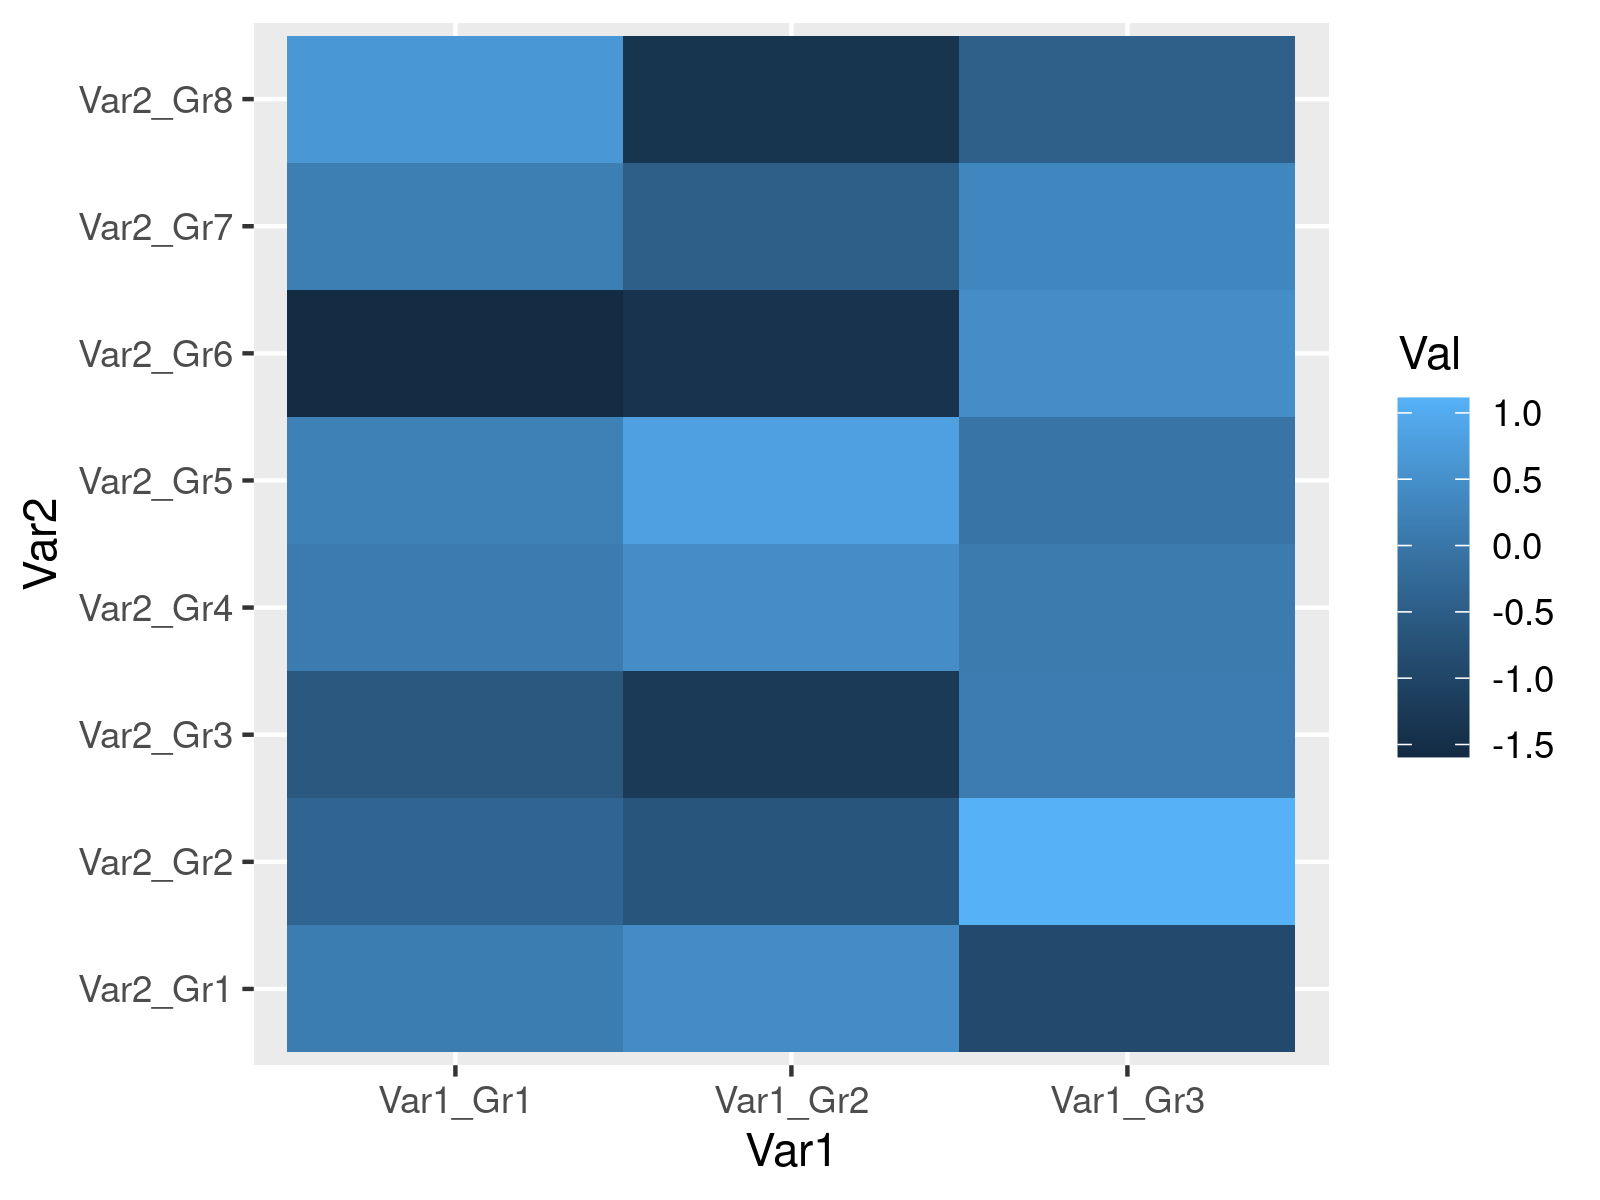
my_plot <- ggplot(my_df, aes(Var1, Var2)) + # ggplot2 heatmap without labels geom_tile(aes(fill = Val)) my_plot |
my_plot <- ggplot(my_df, aes(Var1, Var2)) + # ggplot2 heatmap without labels geom_tile(aes(fill = Val)) my_plot

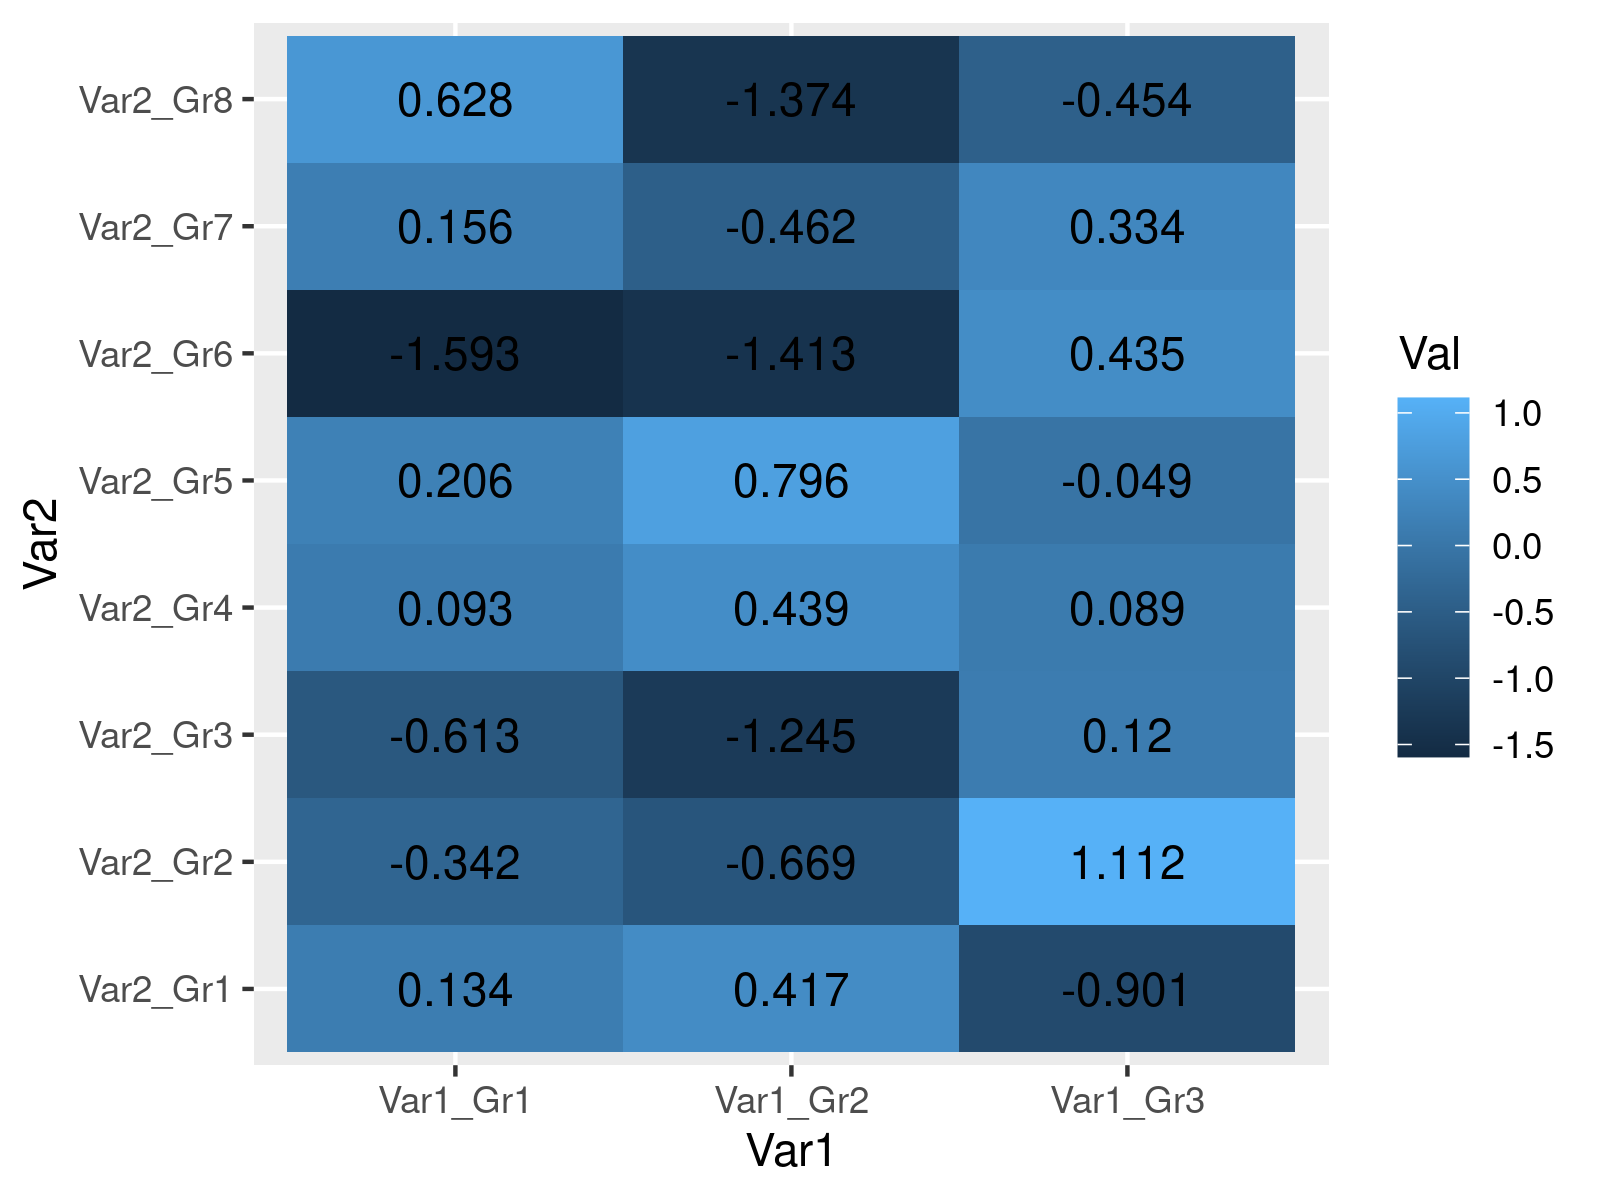
Example: Create ggplot2 Heatmap with Labels Using geom_text() Function
my_plot + # Adding labels to heatmap geom_text(aes(label = Val)) |
my_plot + # Adding labels to heatmap geom_text(aes(label = Val))

