How to Color a Graph by Factor in R (2 Examples)
On this page, I’ll show how to change the colors of a graph based on a factor column in R programming.
Setting up the Examples
data(iris) # Load iris data head(iris) # Head of iris data # Sepal.Length Sepal.Width Petal.Length Petal.Width Species # 1 5.1 3.5 1.4 0.2 setosa # 2 4.9 3.0 1.4 0.2 setosa # 3 4.7 3.2 1.3 0.2 setosa # 4 4.6 3.1 1.5 0.2 setosa # 5 5.0 3.6 1.4 0.2 setosa # 6 5.4 3.9 1.7 0.4 setosa |
data(iris) # Load iris data head(iris) # Head of iris data # Sepal.Length Sepal.Width Petal.Length Petal.Width Species # 1 5.1 3.5 1.4 0.2 setosa # 2 4.9 3.0 1.4 0.2 setosa # 3 4.7 3.2 1.3 0.2 setosa # 4 4.6 3.1 1.5 0.2 setosa # 5 5.0 3.6 1.4 0.2 setosa # 6 5.4 3.9 1.7 0.4 setosa
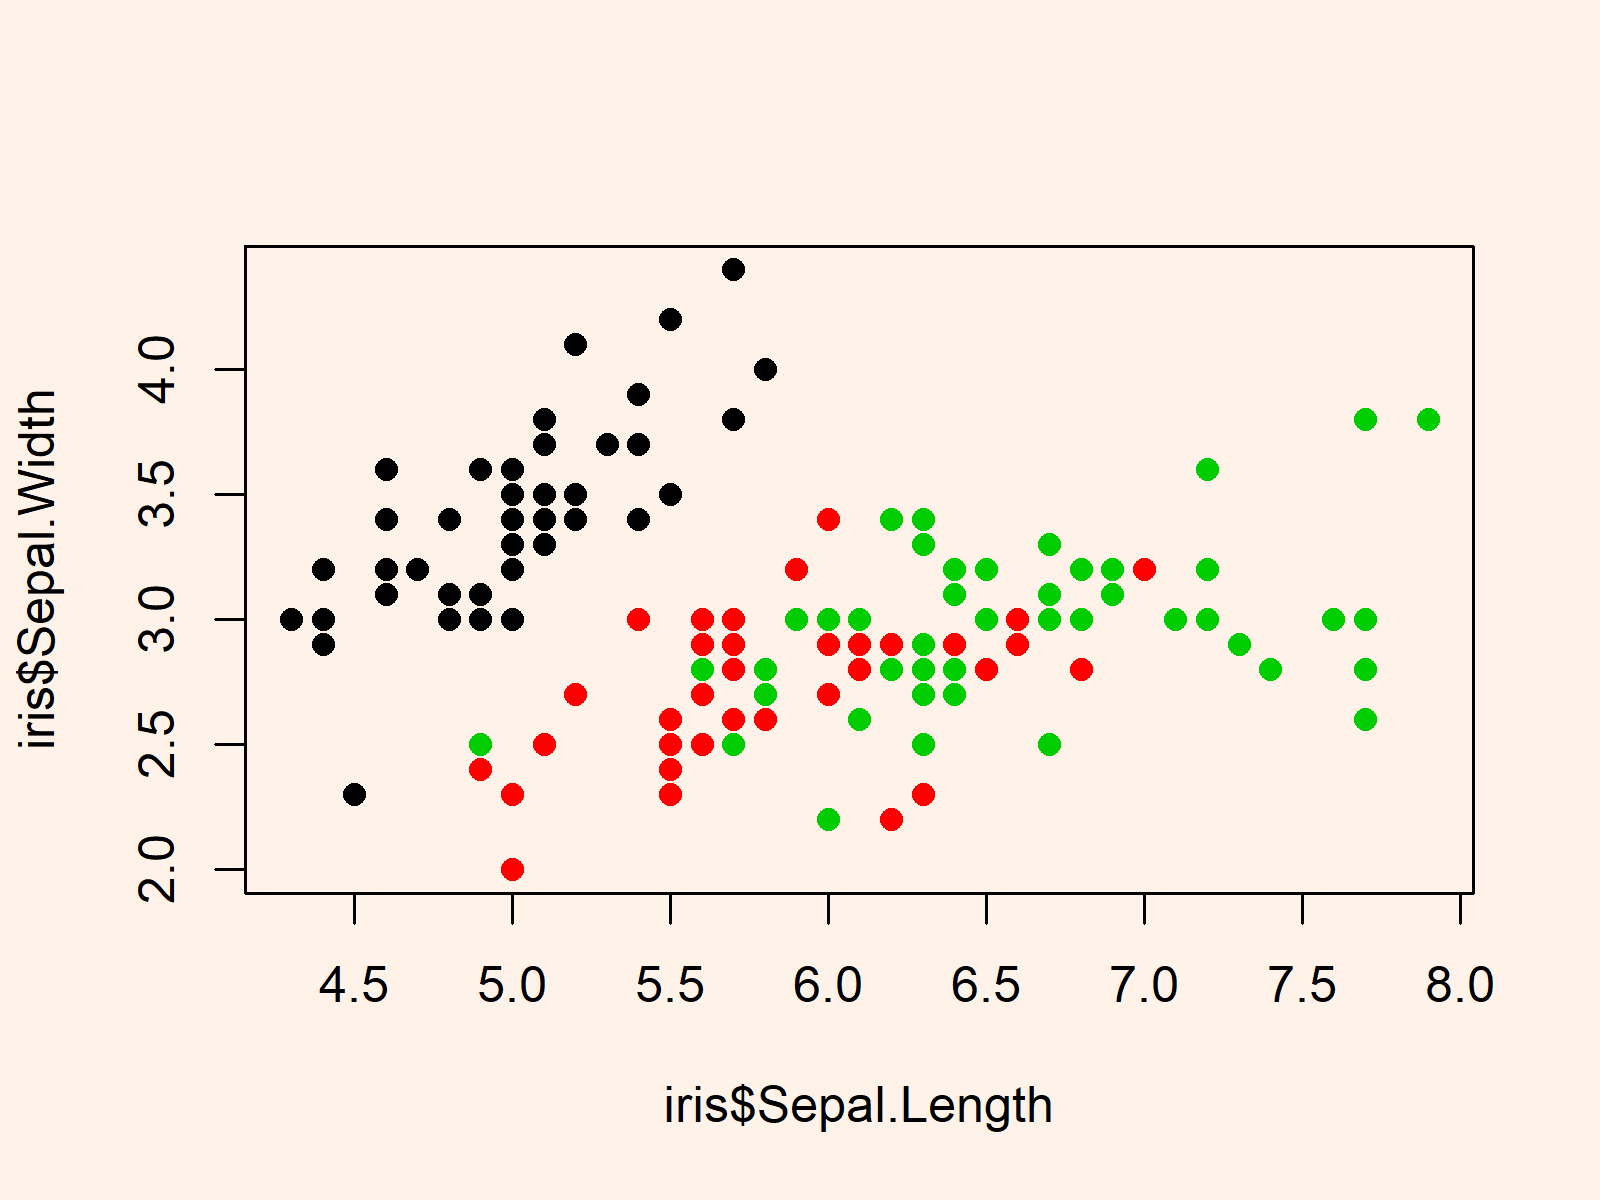
Example 1: Creating Graph with Factor Colors in Base R
plot(x = iris$Sepal.Length, # Plotting in Base R y = iris$Sepal.Width, col = iris$Species, pch = 16) |
plot(x = iris$Sepal.Length, # Plotting in Base R y = iris$Sepal.Width, col = iris$Species, pch = 16)

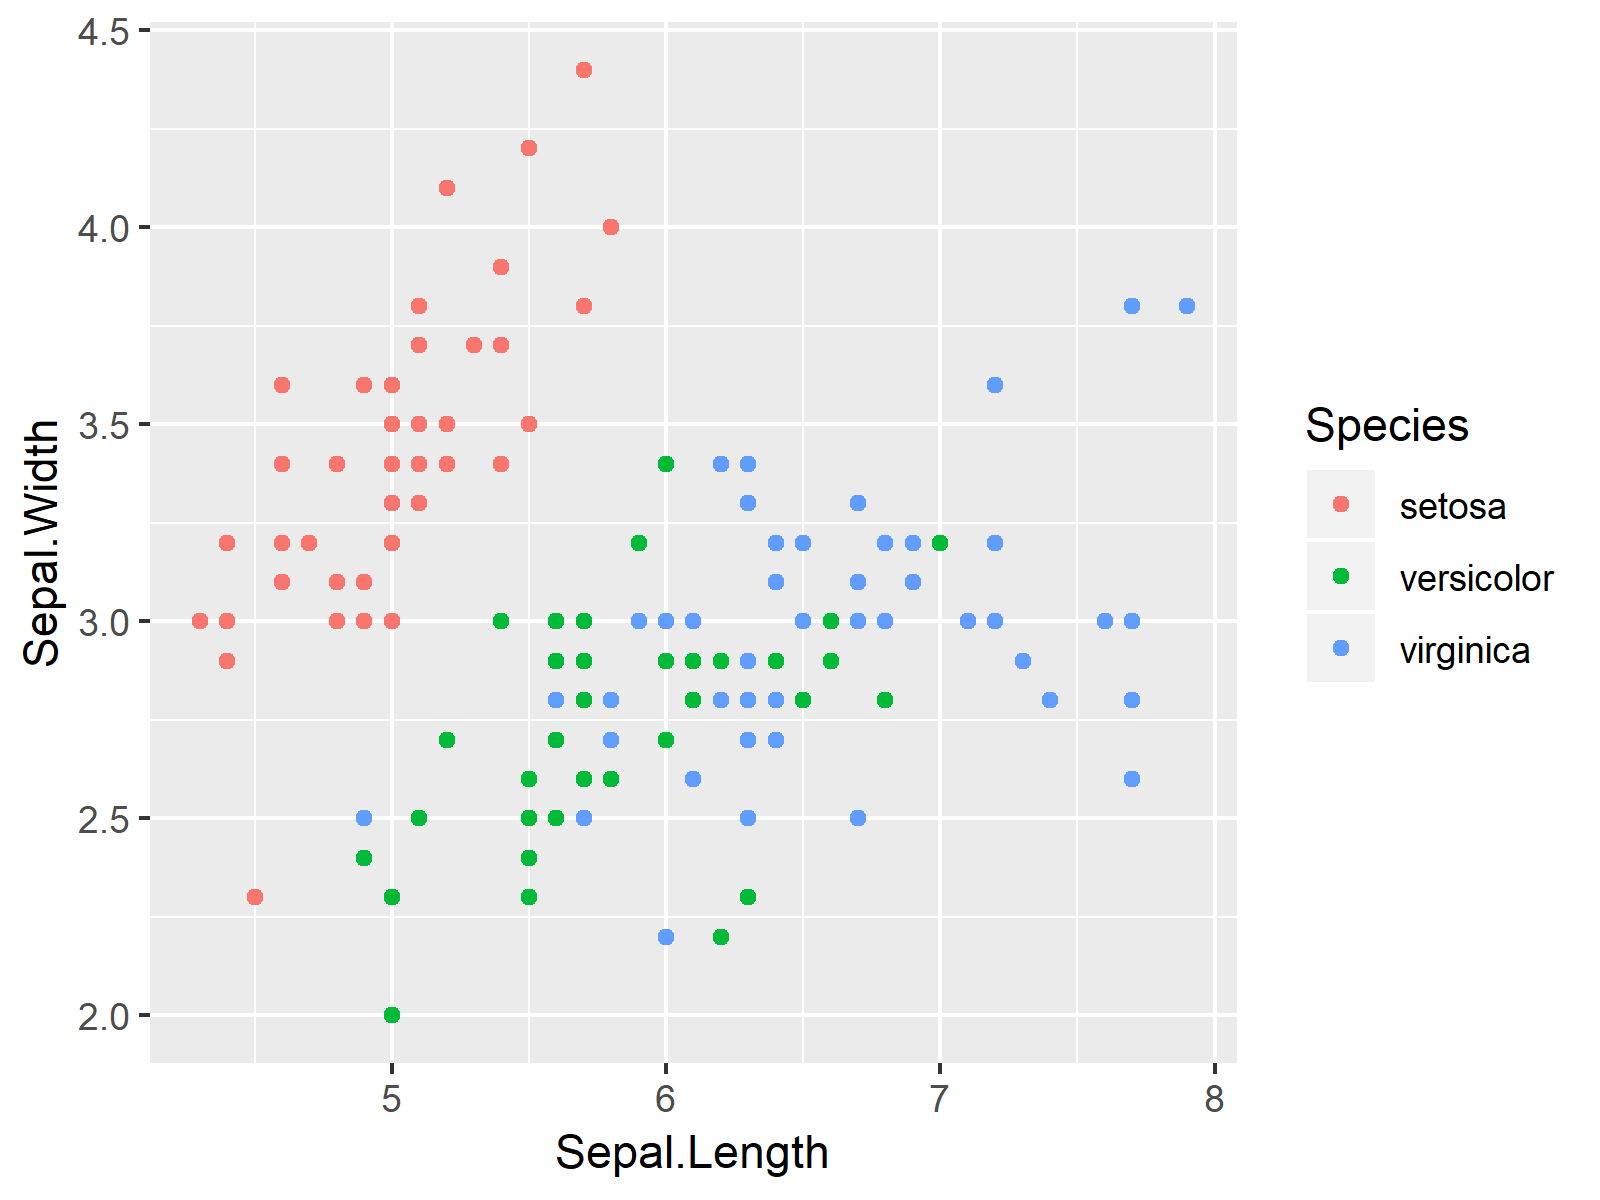
Example 2: Creating Graph with Factor Colors with ggplot2 Package
First, we have to install and load the ggplot2 package:
install.packages("ggplot2") # Install ggplot2 package library("ggplot2") # Load ggplot2 |
install.packages("ggplot2") # Install ggplot2 package library("ggplot2") # Load ggplot2
ggplot(iris, # Plotting with ggplot2 package aes(x = Sepal.Length, y = Sepal.Width, col = Species)) + geom_point() |
ggplot(iris, # Plotting with ggplot2 package aes(x = Sepal.Length, y = Sepal.Width, col = Species)) + geom_point()

