How to Apply the exp() Function in R (2 Examples)
This page illustrates how to compute exponentials using the exp function in the R programming language.
Creation of Example Data
x <- -5:5 # Create example vector x # Dlay example vector in RStudio console # [1] -5 -4 -3 -2 -1 0 1 2 3 4 5 |
x <- -5:5 # Create example vector x # Dlay example vector in RStudio console # [1] -5 -4 -3 -2 -1 0 1 2 3 4 5
Example 1: How to Apply the exp() Function
exp(x) # Applying exp function to vector object # [1] 6.737947e-03 1.831564e-02 4.978707e-02 1.353353e-01 3.678794e-01 # [6] 1.000000e+00 2.718282e+00 7.389056e+00 2.008554e+01 5.459815e+01 # [11] 1.484132e+02 |
exp(x) # Applying exp function to vector object # [1] 6.737947e-03 1.831564e-02 4.978707e-02 1.353353e-01 3.678794e-01 # [6] 1.000000e+00 2.718282e+00 7.389056e+00 2.008554e+01 5.459815e+01 # [11] 1.484132e+02
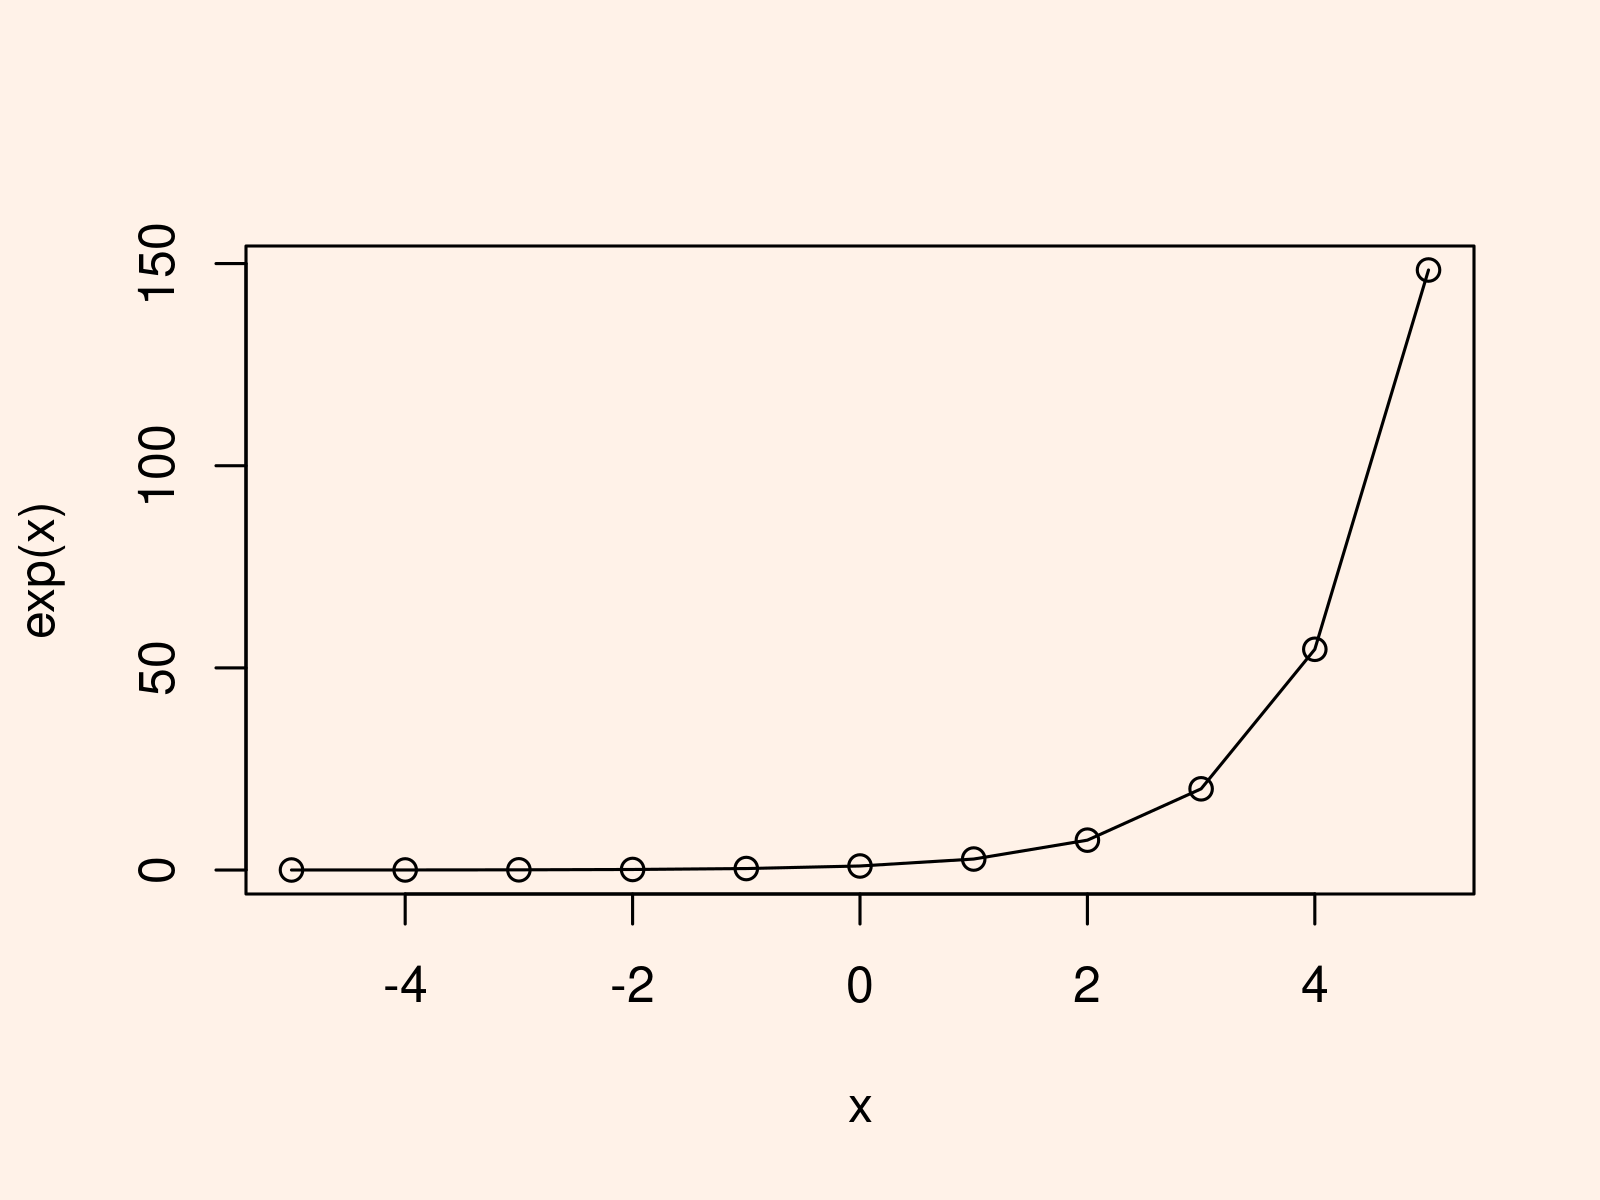
Example 2: Draw Plot of Exponential Function
plot(x, exp(x)) # Drawing output of exp function as points lines(x, exp(x)) # Drawing output of exp function as lines |
plot(x, exp(x)) # Drawing output of exp function as points lines(x, exp(x)) # Drawing output of exp function as lines

