Add Significance Levels to ggplot2 Plot Using ggsignif Package in R (Example Code)
This article explains how to annotate significance levels to a ggplot2 graph in the R programming language.
Setting up the Example
data(iris) # Load example data head(iris) # Sepal.Length Sepal.Width Petal.Length Petal.Width Species # 1 5.1 3.5 1.4 0.2 setosa # 2 4.9 3.0 1.4 0.2 setosa # 3 4.7 3.2 1.3 0.2 setosa # 4 4.6 3.1 1.5 0.2 setosa # 5 5.0 3.6 1.4 0.2 setosa # 6 5.4 3.9 1.7 0.4 setosa |
data(iris) # Load example data head(iris) # Sepal.Length Sepal.Width Petal.Length Petal.Width Species # 1 5.1 3.5 1.4 0.2 setosa # 2 4.9 3.0 1.4 0.2 setosa # 3 4.7 3.2 1.3 0.2 setosa # 4 4.6 3.1 1.5 0.2 setosa # 5 5.0 3.6 1.4 0.2 setosa # 6 5.4 3.9 1.7 0.4 setosa
install.packages("ggplot2") # Install & load ggplot2 library("ggplot2") |
install.packages("ggplot2") # Install & load ggplot2 library("ggplot2")
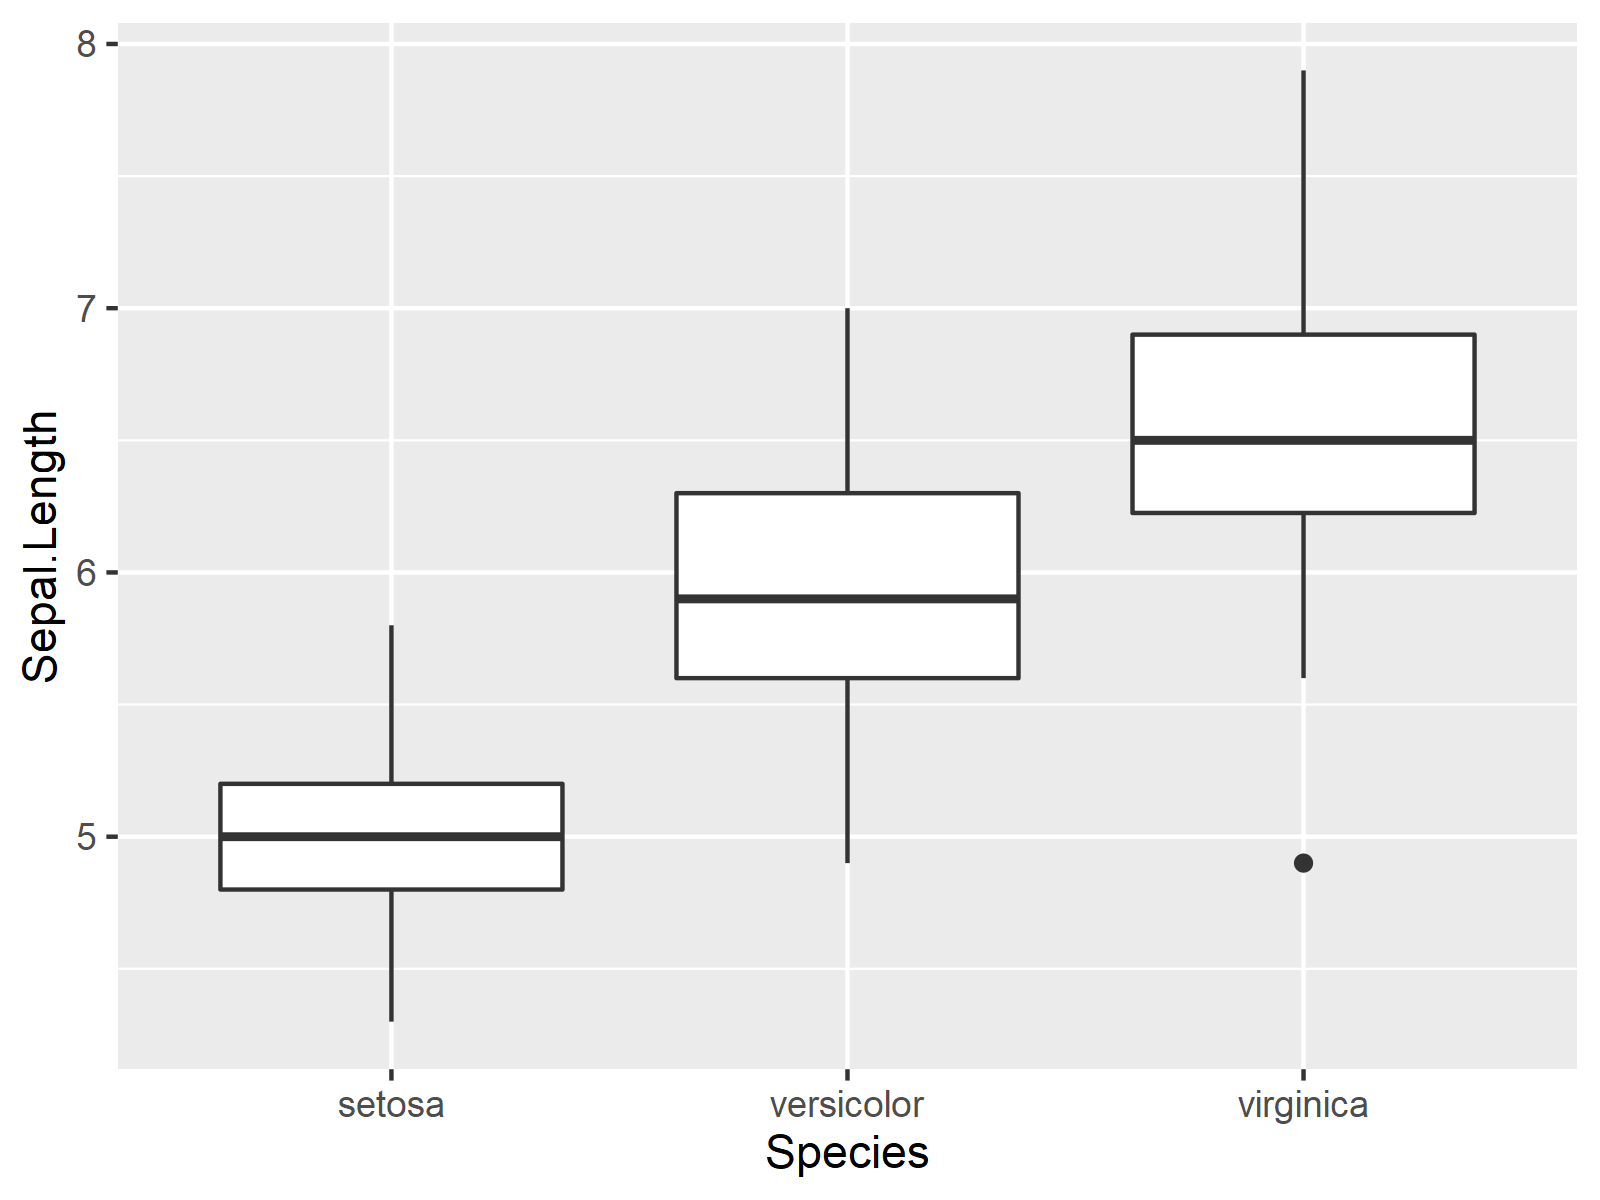
my_ggplot <- ggplot(iris, # Drawing a regular ggplot2 boxplot aes(x = Species, y = Sepal.Length)) + geom_boxplot() my_ggplot |
my_ggplot <- ggplot(iris, # Drawing a regular ggplot2 boxplot aes(x = Species, y = Sepal.Length)) + geom_boxplot() my_ggplot

Example: Annotate Significance Levels to ggplot2 Boxplot
install.packages("ggsignif") # Install & load ggsignif library("ggsignif") |
install.packages("ggsignif") # Install & load ggsignif library("ggsignif")
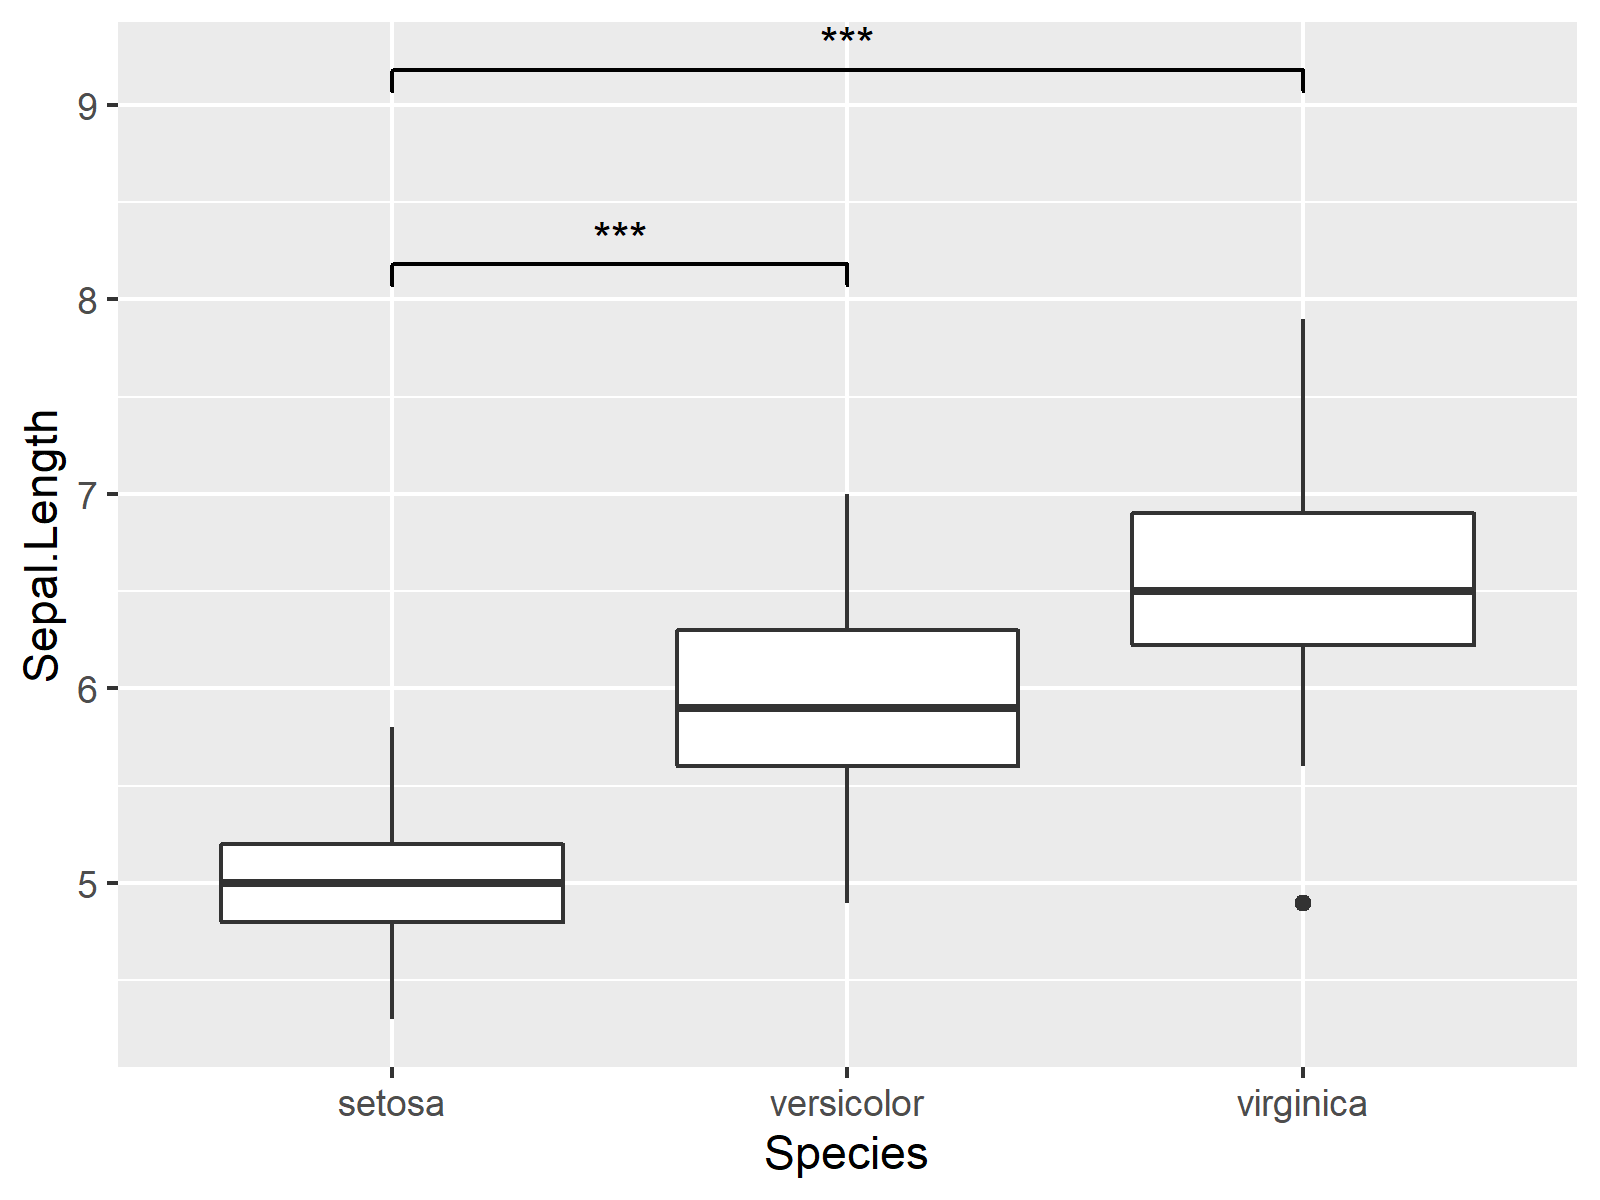
my_ggplot + # Adding significance stars geom_signif(comparisons = list(c("setosa", "versicolor"), c("setosa", "virginica")), map_signif_level = TRUE, y_position = c(8, 9)) |
my_ggplot + # Adding significance stars geom_signif(comparisons = list(c("setosa", "versicolor"), c("setosa", "virginica")), map_signif_level = TRUE, y_position = c(8, 9))

